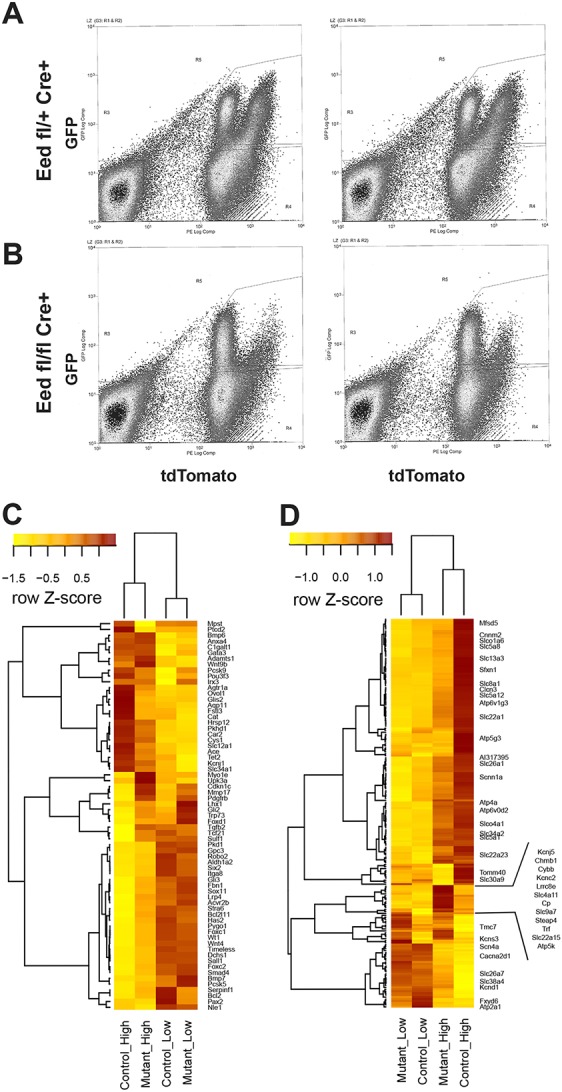
Fig. 3.

RNA-seq analysis of tdTomato-expressing cells. (A) FACS of kidney cells from Six2-TGC, Eed fl/+, R26R-tdTomato reporter mice. The results from two individual mice are shown, representative of 10 biological replicates. x-axis: tdTomato expression level; y-axis: GFP expression level. (B) FACS of Six2-TGC, Eed fl/fl, R26R-tdTomato reporter mice. (C,D) Heatmaps summarizing the expression of (C) kidney development (GO: 0001822) and (D) ion transport (GO:0006811)-specific gene sets identified as being differential. Expression values are normalized along the rows using Z-score transformation. Only selected genes are labeled in (D) for clarity.
