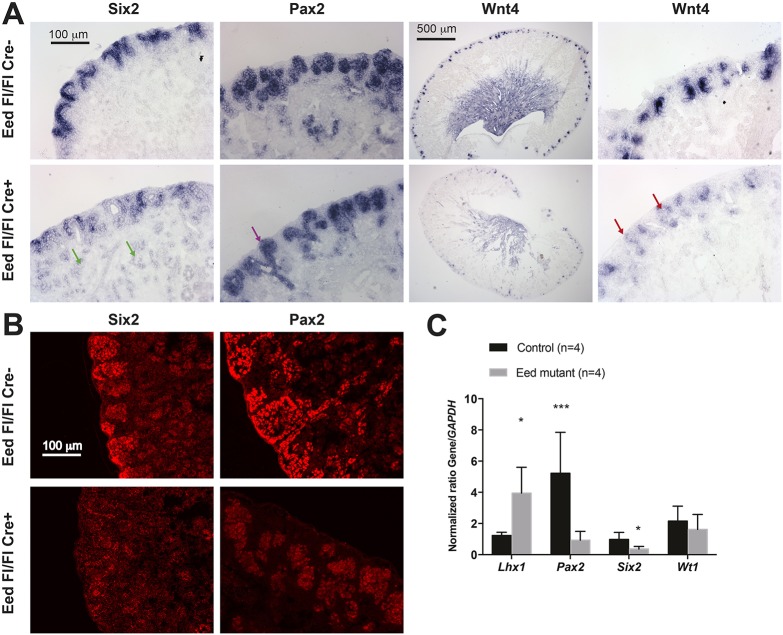
Fig. 4.
Gene expression analysis of Eed mutant kidneys. (A) In situ hybridization analysis of P0 kidneys. Top row: Eed fl/fl; bottom row: Six2-TGC, Eed fl/fl. The probe used is noted at the top of each column. Wnt4 is shown as both a low-power image and a higher-power image, whereas all others are at higher power. Green arrows indicate ectopic Six2 expression; purple arrow indicates Pax2-expressing ureteric bud without differentiating nephron structures; and red arrows indicate ectopic Wnt4 expression in the usual location of the cap mesenchyme adjacent to ureteric bud. The images are representative of three kidneys for each genotype. (B) Immunostaining of SIX2 and PAX2 in P2 kidneys. Top row: Six2-TGC, Eed fl/+; bottom row: Six2-TGC, Eed fl/fl. The images are representative of three kidneys for each genotype. (C) qPCR analysis of gene expression. *P<0.05, ***P<0.01.

