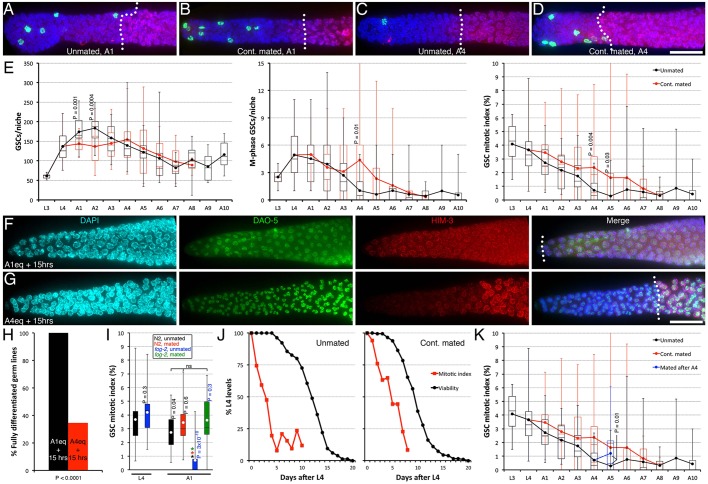
Fig. 1.
Reversible promotion of GSC quiescence. (A-D) A representative distal germ line dissected from unmated A1 (A), continually mated A1 (B), unmated A4 (C) and continually mated A4 (D) wild-type animals, stained with DAPI (DNA; blue), anti-phospho[ser10] histone H3 (M-phase GSCs; green) and anti-HIM-3 (differentiated GSC progeny; red). (E) Time-course quantification of GSC numbers (left), M-phase GSCs (middle), and mitotic index (MI) (right) in unmated (black) and continually mated (cont. mated; red) wild-type hermaphrodites. (F-H) L4 hermaphrodites carrying a conditional loss-of-function mutation in the Notch receptor, glp-1(e2141), were maintained unmated under permissive conditions for the equivalent of 1 day (A1eq; F) or 4 days (A4eq; G) (see Materials and Methods), then shifted to restrictive conditions for 15 additional hours. Representative distal germ lines dissected and stained with DAPI (DNA; cyan), anti-DAO-5 (nucleolar marker, used as a permeabilization control; green) and anti-HIM-3 (differentiation marker; red) are shown. n, 16-29. Similar results were obtained with the glp-1(q231) allele (data not shown). (H) Quantification of data shown in F,G. Statistical analysis, Fisher's exact test. (I) The GSC MI in sperm-less fog-2(oz40) mutant hermaphrodites was normal during L4, but was significantly reduced at A1. This was fully rescued if fog-2 hermaphrodites were mated. Colour-coded asterisks indicate statistical significance (P<0.05; ANOVA with Holm multiple comparisons) among A1 samples. ns, not significant. Colour-coded P values (left of bar, vs same-age; right of bar, vs younger same-genotype) from pairwise two-tailed t-test comparisons are also shown. (J) MI data shown in E was re-scored as a percentage of L4 levels and plotted along with the hermaphrodite survival decline curve obtained under our unmated (left; n=181) and continually mated (right; n=136) conditions. (K) Wild-type hermaphrodites were maintained unmated until the end of A4, then mated for an additional day (blue). (A-D,F-G) A dotted line approximates the boundary between undifferentiated (HIM-3 negative) and differentiated (HIM-3 positive) germ cells. Distal is to the left. Scale bars: 20 μm. (E,I,K) Dots mark averages, boxes and brackets represent the whole sample, divided into quartiles. n=12-40, except unmated A7 (10), A8 (9), A9 (6), and cont. mated A8 (3). (E,K) Significant P values from pairwise two-tailed t-test comparisons are shown.

