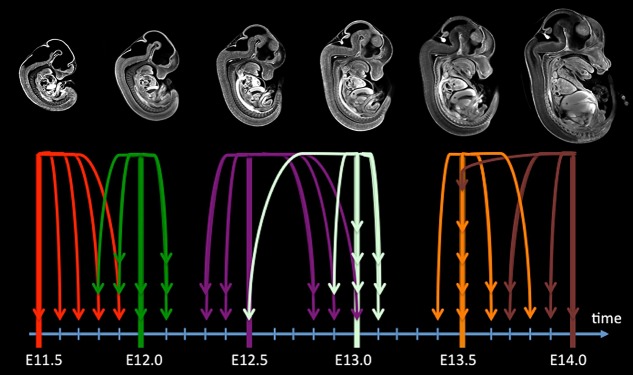
Fig. 4.
Re-timestamping the initial set of images according to the second iteration of the 4D atlas. This schematic shows the evaluated stage of each of the mouse embryos in the original set. Embryos that were staged either older than E14.0 or younger than E11.5 are not shown (n=5). Arrow color indicates embryos extracted on the same dpc. The stage of mouse embryos harvested at a given dpc can deviate by as much as 0.5 dpc from the mean. The calculated average standard deviation of the staged mouse embryos about the six extraction time points is 0.17 dpc.

