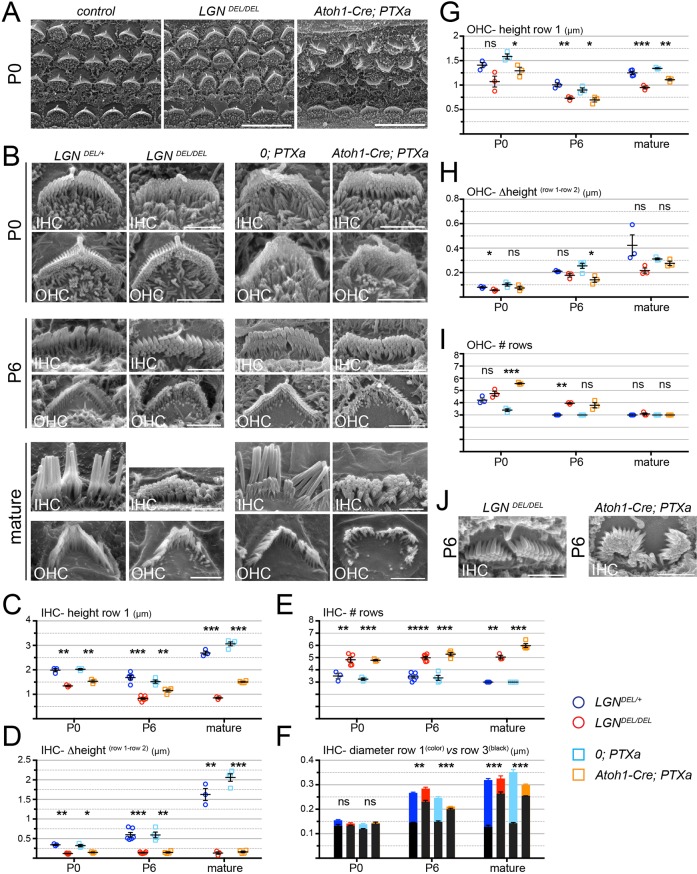
Fig. 2.
Hair bundle defects in the absence of LGN and Gαi function. (A) Scanning electron microscopy of the organ of Corti at P0 (half-turn) in a control (LgnDEL/+) and in LgnDEL/DEL and Atoh1-Cre; PTXa mutants. (B) Higher magnification medial views of representative single IHCs (top) and OHCs (bottom) at P0, P6 and mature stages. Mature Lgn and PTXa samples are at P14 and P22, respectively. See lateral views in Fig. S3A. (C-F) Quantification of IHC stereocilia height in the first row (C), the height differential between the first and second row (D), the number of rows across the bundle (E), and the stereocilia thickness in the first (colored) and third (black) rows (F). (G-I) Quantification of OHC stereocilia height in the first row (G), the height differential between the first and second row (H), and the number of rows across the bundle (I). (J) Representative examples of defective stereocilia distribution in LgnDEL/DEL and Atoh1-Cre; PTXa mutants. 0; PTXa controls have the Rosa26-(stop)-PTXa allele, but lack the Atoh1-Cre transgene. Average per animal±s.e.m. is plotted for n≥3 animals. Welch's t-test (ns, P>0.05; *P≤0.05; **P≤0.01; ***P≤0.001; ****P≤0.0001). In F, the t-test reflects thickness differences in row 3. All stereocilia quantifications are detailed in Tables S1 and S2. Cochleas were analyzed halfway in the basal turn (P0, P6) and at the apical turn (mature). Scale bars: 10 µm in A; 2 µm in B,J.

