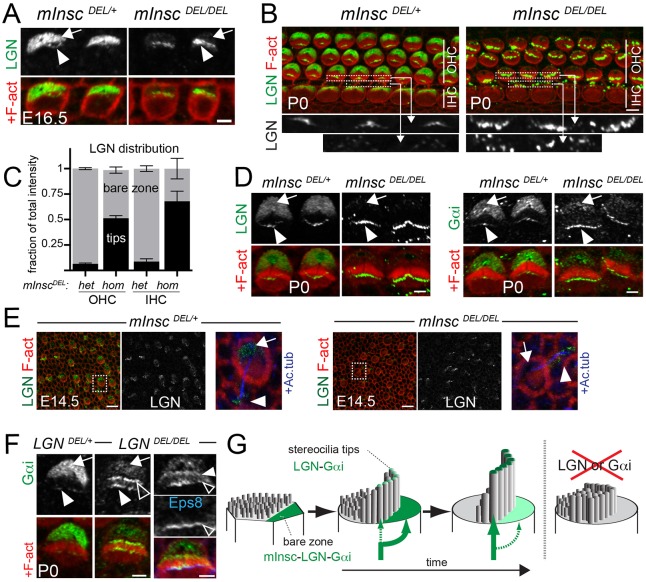
Fig. 4.
Balanced LGN-Gαi distribution between the bare zone and stereocilia tips. (A) LGN immunostaining at E16.5 (apical turn) in the indicated genotypes. Mutant IHCs have decreased levels of LGN at the bare zone (arrow) and increased LGN levels in stereocilia (arrowhead). (B) LGN immunostaining at P0. Boxed regions are shown at higher magnification underneath and specifically show LGN stereocilia enrichment in OHCs and IHCs. (C) Fraction of total LGN staining intensity at the bare zone (gray) and stereocilia tips (black) in OHCs and IHCs of P0 InscDEL/DEL and control littermates (mean±s.e.m.). Nine OHCs (three per row) and three IHCs at the cochlea base were analyzed for n≥3 animals for each genotype. (D) LGN (left) and Gαi (right) immunostaining in P0 OHCs. (E) LGN immunostaining in utricular epithelium at E14.5. A single HC (boxed) is magnified in the right-most panels, where acetylated tubulin (Ac. tub) co-staining reveals the kinocilium in blue. (F) Gαi immunostaining at P0 in OHCs. Gαi excess in the bundle is seen at the tips (solid arrowhead) and the base (open arrowhead) of stereocilia. In the right-most panels, stereocilia tips are labeled with Eps8 (blue). Arrows and arrowheads indicate the bare zone and stereocilia tips, respectively. (G) Model depicting the Insc-LGN-Gαi complex distribution (green) during HC differentiation and the mutant phenotype. Scale bars: 2 µm in A,D,F; 5 µm in B; 10 µm in E.

