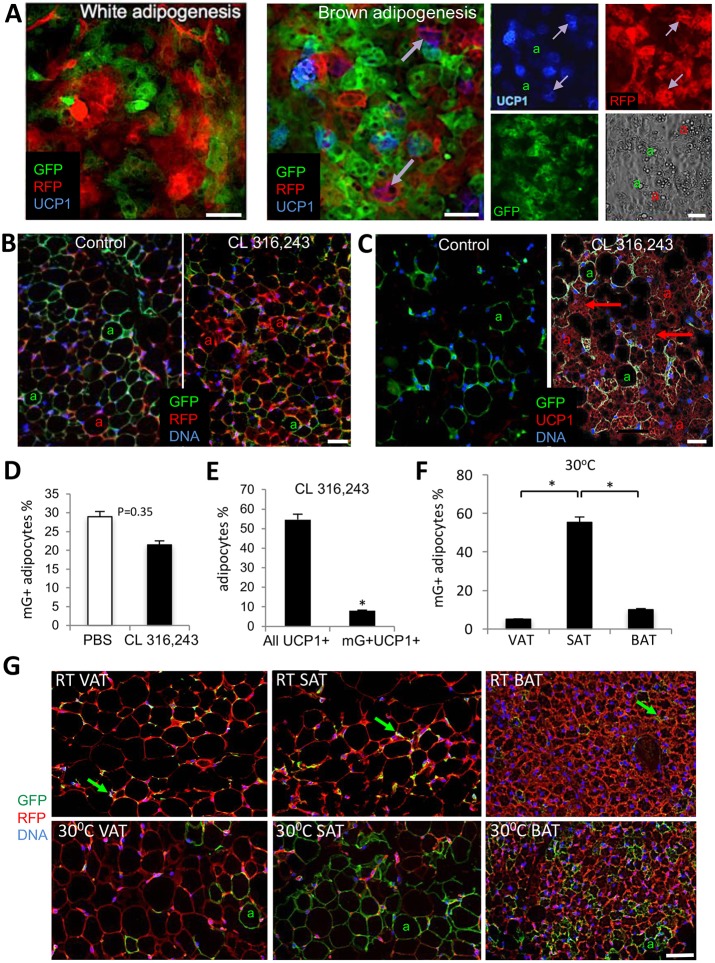
Fig. 2.
The PDGFRβ+ lineage contribution to the beige adipocyte pool is minimal. (A) Cultured SVF from SAT of Pdgfrb-Cre; mT/mG mouse were subjected to white or brown adipogenesis induction. Fixed cells were analyzed by immunofluorescence with RFP (red), GFP (green) and UCP1 (blue) antibodies. Arrows indicate expression of UCP1 in mT+ (purple) but not in mG+ adipocytes (a). Separate channels are shown on the right; phase-contrast image shows adipocyte lipid droplets. (B,C) Paraffin wax-embedded sections of SAT from Pdgfrb-Cre; mT/mG mice 7 days after injection with PBS (control) or the β3AR activator CL 316,243. Nuclei are blue. (B) Immunofluorescence with RFP (red) and GFP (green) antibodies. (C) Immunofluorescence with UCP1 (red) and GFP (green) antibodies. UCP1 expression is present in multilocular mT+ adipocytes (arrows) but not in unilocular mG+ adipocytes (a). (D) Quantification of data from B. (E) Quantification of data from C. (F) Quantification of 30°C data from G. (G) Paraffin wax-embedded sections of VAT, SAT and BAT from 6-week-old Pdgfrb-Cre; mT/mG mice after 7 days of housing at 30°C or at room temperature subjected to anti-RFP (red)/GFP (green) immunofluorescence showing mG+ ASCs (arrows) at room temperature and mG+ adipocytes (a) at 30°C. In all panels, nuclei are blue. Scale bars: 50 µm. Data are mean±s.e.m. for multiple fields (n=10). *P<0.05 (Student's t-test). Experiments were repeated at least three times with similar results.

