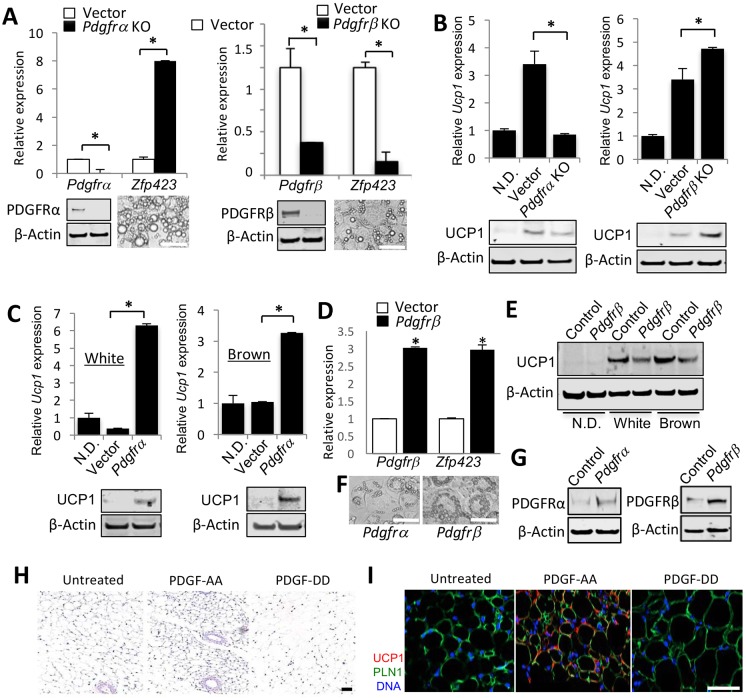
Fig. 5.
PDGFRα/PDGFRβ signaling balance directs adipogenesis. (A) Quantitative RT-PCR analysis of Pdgfra, Pdgfrb and Zfp423 mRNA expression, normalized to 18S RNA, in immortalized brown preadipocytes with knockout (KO) of Pdgfra or Pdgfrb compared with control cells transduced with empty CRISPR/Cas9 vector. Cells were induced to undergo white adipogenesis for 8 days. Below, knockout of PDGFRα and PDGFRβ is confirmed by immunoblots with the corresponding antibody prior to adipogenesis induction. Images show differentiated Pdgfra KO and Pdgfrb KO adipocytes. (B) Quantitative RT-PCR analysis of Ucp1 mRNA expression, normalized to 18S RNA, in immortalized brown preadipocytes lacking Pdgfra or Pdgfrb compared with control cells transduced with empty CRISPR/Cas9 vector. Cells were induced to undergo adipogenesis for 8 days prior to analysis. Baseline control is non-differentiated cells (N.D.). Changes in UCP1 protein expression are confirmed by immunoblotting. (C) Quantitative RT-PCR analysis of Ucp1 gene expression, normalized to 18S RNA, in 3T3-L1 cells transduced with an ectopic Pdgfra expression vector or empty lentiviral vector. Cells were induced to undergo white or brown adipogenesis for 8 days prior to analysis. Baseline control is non-differentiated cells (N.D.). Changes in UCP1 protein expression are confirmed by immunoblotting. (D) Quantitative RT-PCR analysis of Pdgfrb and Zfp423 gene expression, normalized to 18S RNA, in 3T3-L1 cells transduced with an ectopic Pdgfrb expression vector or empty lentiviral vector. In A-D, data are mean±s.e.m. for two qPCR reactions; *P<0.05 (Student's t-test). (E) UCP1 immunoblotting of extracts from immortalized brown preadipocytes transduced with doxycycline-inducible Pdgfrb expression lentivirus. Cells were induced to undergo white or brown adipogenesis for 8 days prior to analysis and not treated (control) or treated (Pdgfrb) with doxycycline prior to differentiation induction. Baseline control is non-differentiated cells (N.D.). (F) Images of adipocytes differentiated from 3T3-L1 cells overexpressing Pdgfrα or Pdgfrb. (G) Immunoblotting of cells from C and D prior to adipogenesis induction showing the extent of Pdgfra and Pdgfrb overexpression. In all blots, β-actin immunoblotting is a protein-loading control. (H,I) Paraffin wax-embedded sections of SAT from mice treated with PDGF-AA or PDGF-DD; control mice were injected with PBS. (H) Hematoxylin and Eosin staining reveals smaller adipocyte in PDGF-AA-treated mice. (I) Anti-UCP1 immunofluorescence/anti-perilipin 1 immunofluorescence reveals UCP1 expression in PDGF-AA-treated mice. Scale bars: 50 µm. Nuclei are blue.

