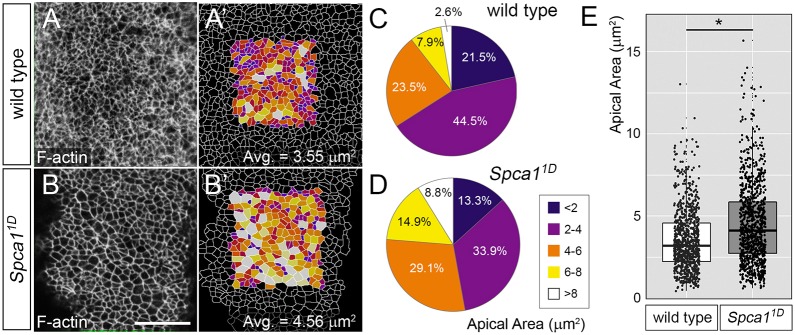
Fig. 5.
Analysis of apical constriction in Spca11D mutants. (A,B) Phalloidin staining of F-actin in the anterior spinal cord region of whole-mount wild-type and Spca11D embryos (en face view). (A′,B′) Semi-automated cell outlines generated in ImageJ and color coded based on size of apical area (see C,D). Scale bar: 20 µm. (C,D) Distribution of cell apical areas in wild-type and Spca11D neuroepithelia. (E) Box plot showing the apical area of cells in wild-type and Spca11D neuroepithelia. Data in C-E corresponds to 834 cells from four wild-type embryos and 966 cells from four Spca11D mutant embryos. The line represents the median, the box indicates the distance between the first and third quartile (interquartile range; IQR), whiskers represent ±1.5*IQR and points represent all individual measurements. *P<0.001.

