Fig. 7.
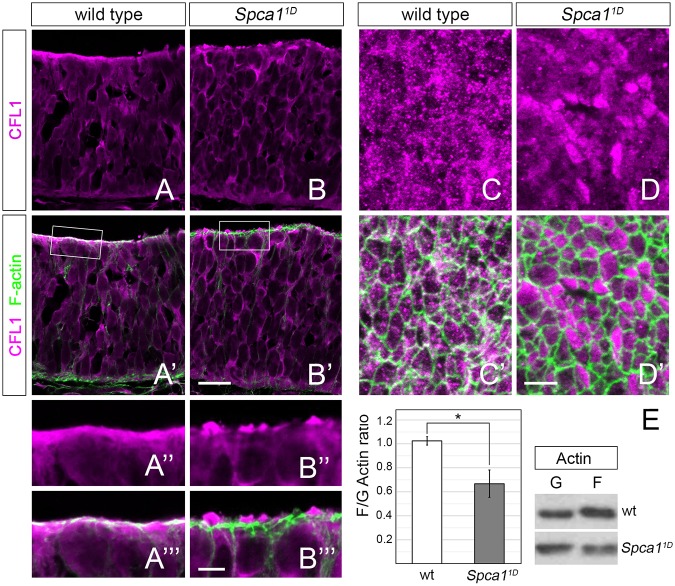
Cofilin 1 localization and actin dynamics in Spca11D mutants. (A-B′) Immunodetection of CFL1 (magenta) and F-actin (green) in transverse sections of the E9.5 wild-type and Spca11D neuroepithelia. Scale bar: 20 µm. (A″-B‴) Magnified views of CFL1 and F-actin localization in the boxed areas in A′ and B′. Scale bar: 5 µm. (C-D′) En face views of CFL1 (magenta) and F-actin (green) localization in E9.5 wild-type and Spca11D embryos. Scale bar: 5 µm. (E) Western blot of F- and G-actin fractions isolated from wild-type and Spca11D embryos (right) and quantification of F/G actin ratios (left, n=5). Error bars indicate s.e.m. *P<0.05.

