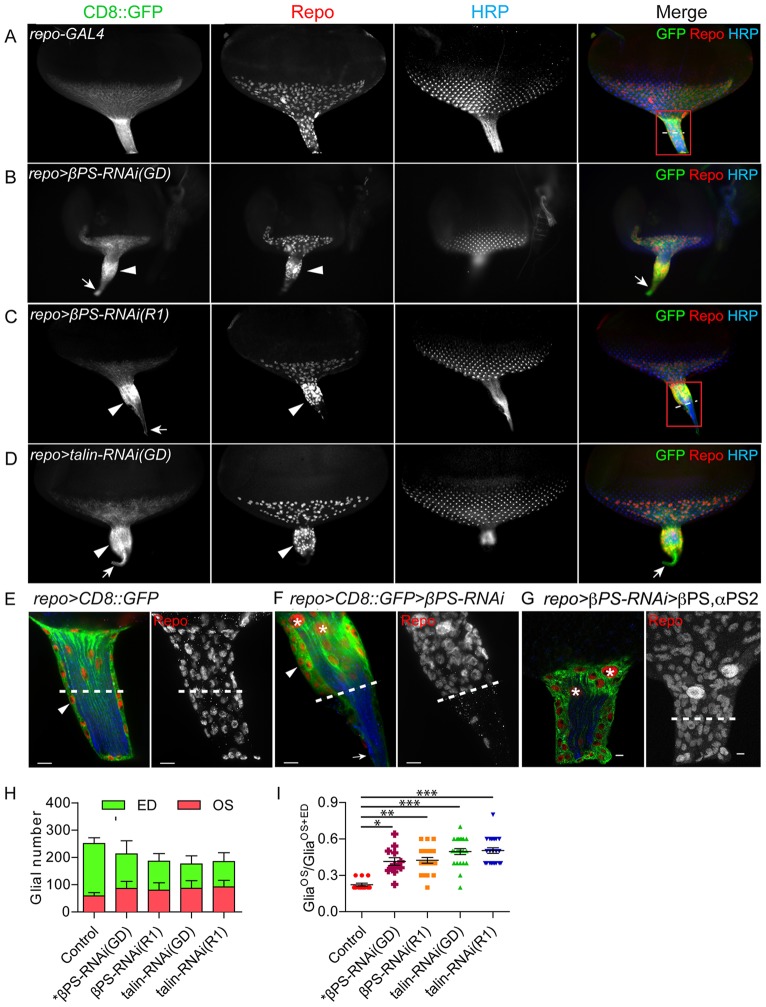
Fig. 2.
Alterations in OS morphology and glial migration upon downregulation of integrin and talin. RNAi lines were expressed in all glia using repo-GAL4 with UAS-CD8::GFP (green) to label glial membranes. Glial nuclei and photoreceptor cells were immunolabeled with antibodies to Repo (red) and HRP (blue). (A-D) Compared with control (A), repo>βPS-RNAi and repo>talin-RNAi had thicker OSs (B-D, arrowheads). Glial nuclei aggregated at the anterior half of the OS and CD8::GFP-labeled glial membranes extended to the thinner posterior end of the OS (B-D, arrows). (E-G) High-magnification images of control, βPS-RNAi OS and rescued βPS-RNAi OS. (E,F) The boxed regions in A and C are shown at high magnification, with single 0.2 μm sections (left) and projections of the entire z-stack for Repo immunolabeling (right). (F) The PG are multilayered (arrowhead) with a fine projection of CD8::GFP-labeled CG at the proximal end (arrow). Dashed lines show the midpoint of each OS. (G) repo>CD8::GFP>βPS-RNAi(GD) with co-expression of βPS and αPS2, which rescued the glial morphological defects. Asterisks highlight the two CG nuclei. Scale bars: 5 μm. (H) Quantification of glial number separately in the ED and OS in repo>Dicer2 (control, n=13), repo>βPS-RNAi(GD) (n=12), repo>βPS-RNAi(R1) (n=21), repo>talin-RNAi(GD) (n=23) and repo>talin-RNAi(R1) (n=22). Glial number was scored by Repo immunolabeling at wandering L3 with 11-15 rows of ommatidia. (I) The ratio of glia in the OS (GliaOS) compared with glia in the OS plus ED (GliaOS+ED). Larger ratios indicate more glia in the OS. Lines indicate the mean ratio and s.e.m. *P<0.05, **P<0.01, ***P<0.001 (one-way ANOVA with Dunn's multiple comparison test).

