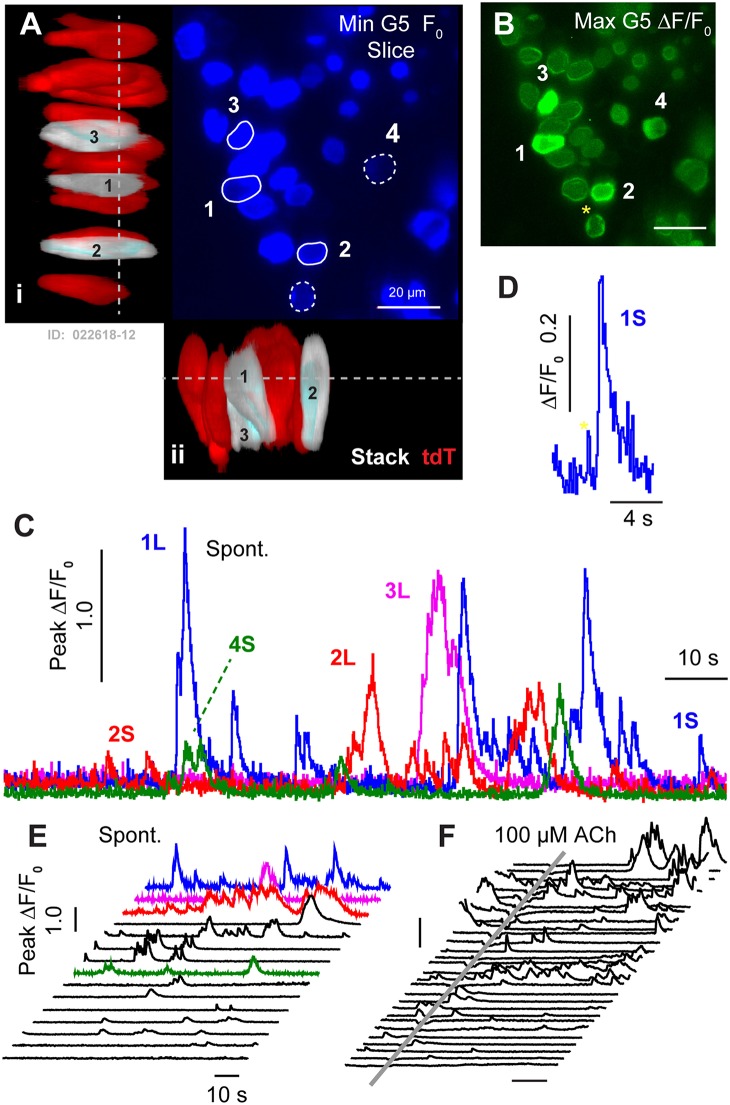
Figure 2.
Spontaneous [Ca2+]i transients in utricular HCs at P1. (A) Resting G5 fluorescence in HCs (F0, blue) in a plan view optical slice, and orthographic projections through the thickness of the epithelium showing expression of tdT (red & white) in HCs. Nominal Z-focus of the plan view is indicated with dashed lines. Three highlighted HCs exhibiting ΔF/F0 transients are pseudo-colored white (1–3). ROIs surrounding 5 cells are shown (white curves, 1–5). (B) Spontaneous [Ca2+]i transients (peak G5 ΔF/F0 over 100 s, green) in tdT expressing HCs, sampled at ten frames per second. SCs lacking resting G5 fluorescence did not exhibit detectable spontaneous transients at P1. The largest [Ca2+]i transients in HCs were located near the plasma membrane (e.g., 4*). (C) ΔF/F0 transients were complex in temporal waveform, as if consisting of the superposition of (D) small “S” events and large “L” calcium transients. (E) Spontaneous ΔF/F0 transients in HCs arranged by increasing magnitude, with colors corresponding to cells in (A–C). (F) Application of ACh did not increase the rate or size of ΔF/F0 transients (arranged by increasing of ΔF/F0). Time near ACh application was blocked by optical interference from the wash. See Supplement Video 1.

