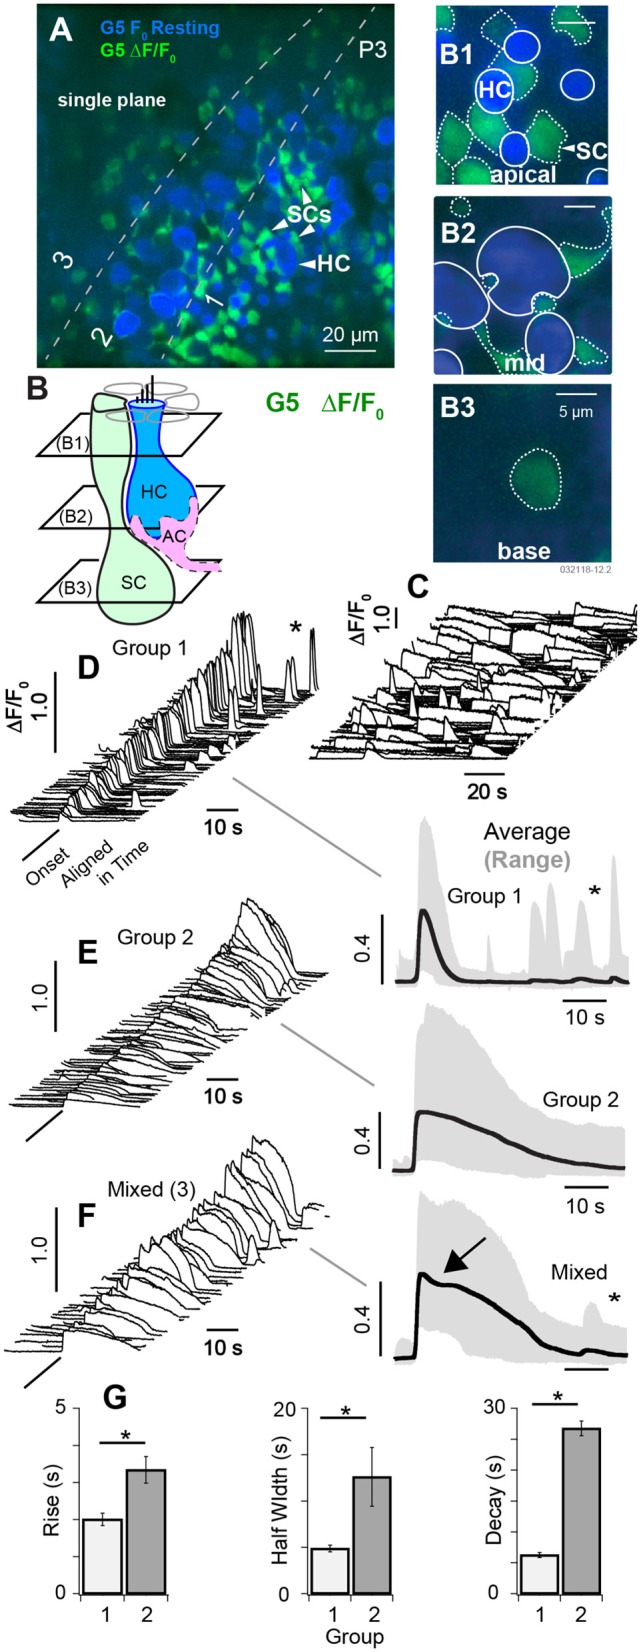
Figure 3.

Spontaneous [Ca2+]i transients in SCs at P3. (A) Single focal plane optically cutting through supporting cells (SCs) and hair cells (HCs) at 3 depths in the tissue (1: apical region, 2: central region, 3: below HCs). Resting, G5 fluorescence (F0 blue) and G5 ΔF/F0 transients (green) are superimposed. (B) Cartoon depicting 3 optical slices through SCs (B1–B3) and two through HCs (B1,B2). The apical region of SCs and HCs (B1), the middle region of SCs and HCs (B2), and the base of SCs (B3). Large spontaneous ΔF/F0 [Ca2+]i transients were present in SCs, most easily identified by their hexagonal pattering around the apical necks of HCs (A,B1). Solid white outlines show HC ROIs with large resting fluorescence, and dotted white lines show ROIs with large ΔF/F0 transients. (C) Example spontaneous ΔF/F0 transients sampled at 10 frames per second unaligned in time. (D–F) Spontaneous ΔF/F0 transients aligned in time and sorted by duration, magnitude, and waveform. ΔF/F0 transient waveforms show the average within 5μm ROIs centered on individual cells. (D) Group 1 short [Ca2+]i transients with duration <10 s. Traces on the right show population averages (black) and range (gray). (E) Group 2 transients with durations >10 s. (F) Mixed transients with some events showing an inflection point just after the peak ΔF/F0 (arrow). (G) Population statistics over all ΔF/F0 transients from P3 aged mice showing the rise time, half width, and decay time by group. See Supplement Videos 2–4. *p = 0.05.
