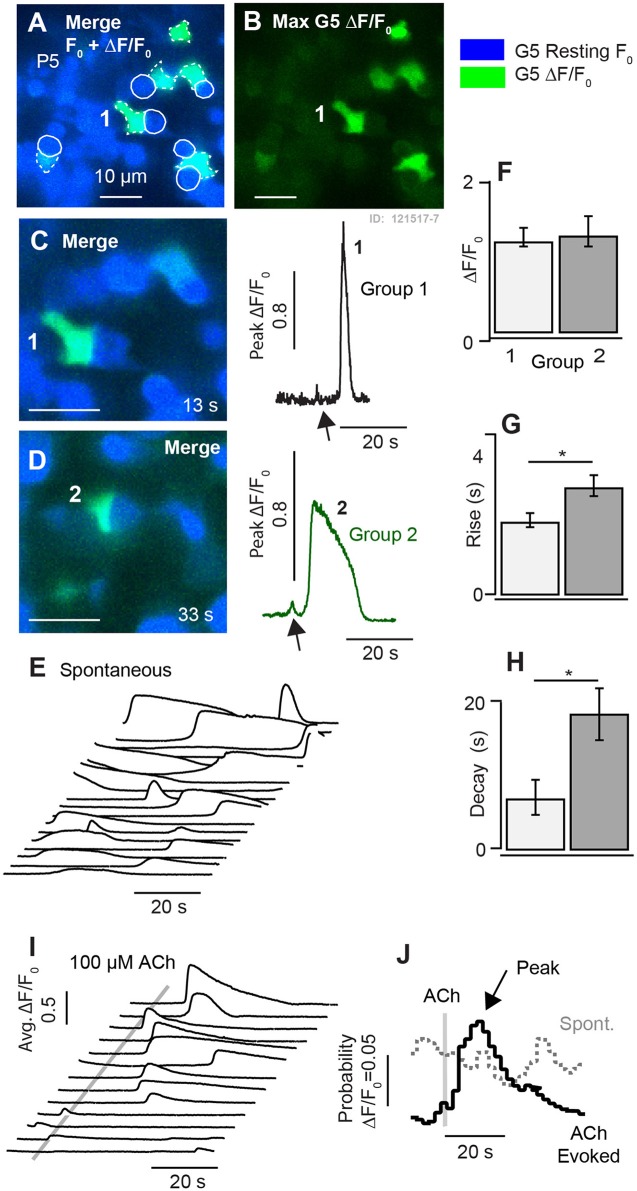
Figure 5.
Synchronization of [Ca2+]i transients by 100μM ACh at P5. (A,B) Resting G5 fluorescence (blue) and spontaneous [Ca2+]i transients based on the maximum G5 ΔF/F (green) over a 100s time sequence imaged at 10 frames per second. (C,D) Two example instants in time showing spontaneous transients in example cells (1–2). (E) Time sequence of spontaneous ΔF/F0 transients in individual cells. (F–H) Population statistics at P5 showing the size, rise time, and decay time of fast (Group 1) and slow (Group 2) transients. (I) Time sequence showing synchronization of ΔF/F0 transients by puff application of 100μM ACh. (J) Stimulus averaged ΔF/F0 transients illustrating synchronization by ACh. *p = 0.05.

