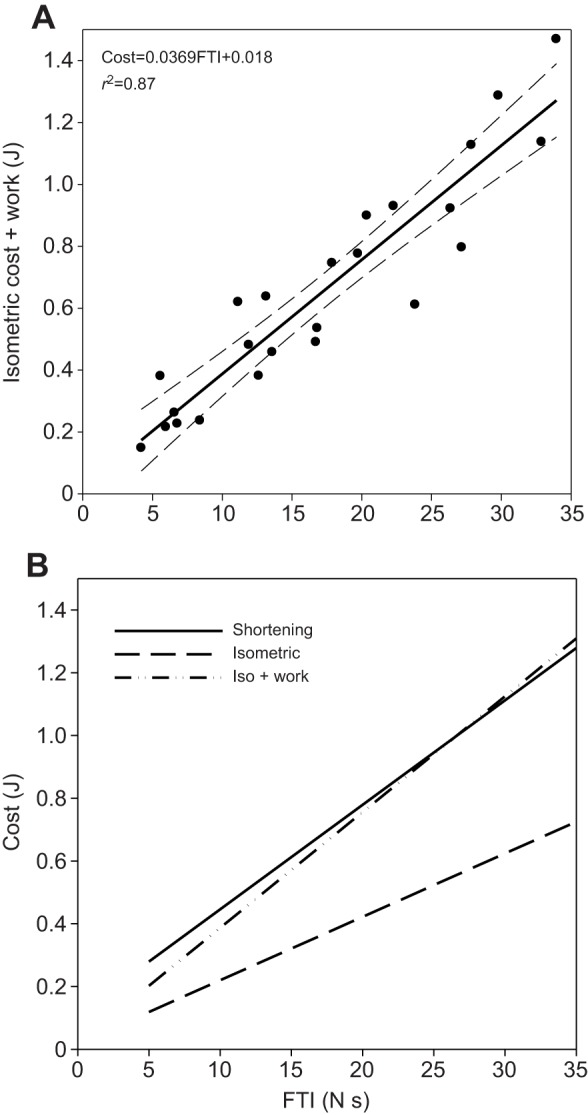
Fig. 2.

Test of the Fenn effect. (A) The measured energy cost of isometric contraction combined with the work done by the FDI muscle during a shortening contraction shown as a function of FTI (filled circles). Solid line represents least square regression equation (R2=0.87) and dashed lines represent the 95% confidence intervals of the regression equations. (B) When the external work (force×distance) done by the FDI muscle during shortening contraction is added to the cost of isometrically producing the same force, the result is a direct test of the Fenn effect. Here, we compare the calculated energy cost of external work performed during shortening contractions added to the isometric cost of force production (Iso + work) and the measured cost of shortening contraction and isometric contraction. In short, these results are consistent with the Fenn effect, Cost=W+I.
