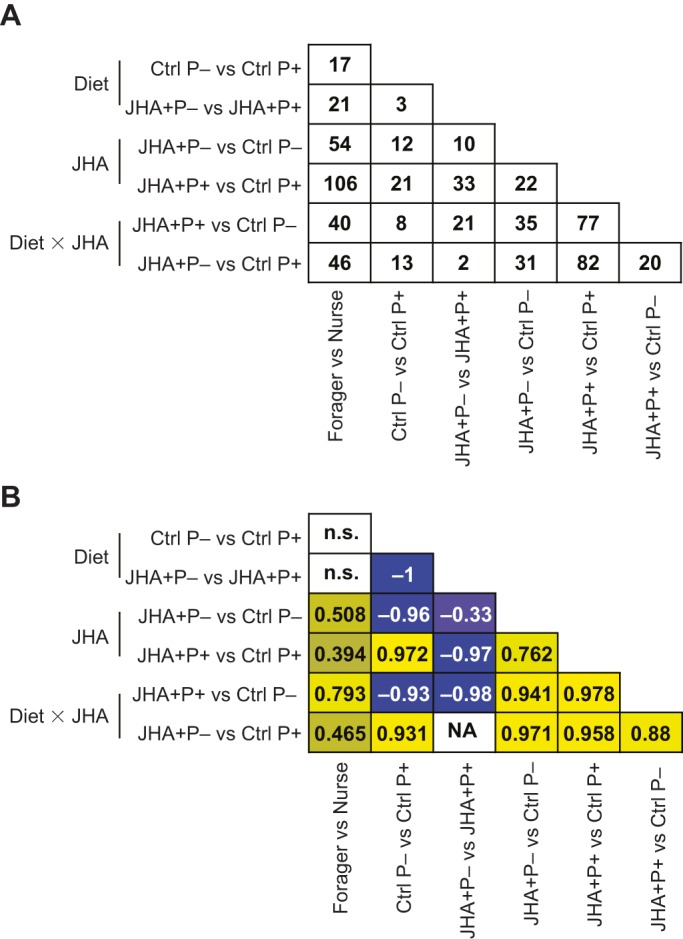
Fig. 3.

Overlap and correlation analyses for genes differentially expressed in the pars intercerebralis of nurses and foragers and as a function of diet and/or JH analog treatments. N=16 for each behavioral group and N=8 for each diet×treatment combination. (A) Number of genes overlapping in various pairwise comparisons. (B) Pearson's correlation coefficients for genes in A. Numbers represent the correlation coefficients that were significant (P<0.05). Yellow denotes positive correlation; blue denotes negative correlation; n.s., not significant, NA: not available; JHA+, JHA treatment; Ctrl, acetone treatment; P+, high protein diet; P−, diet with no protein.
