Fig. 12.
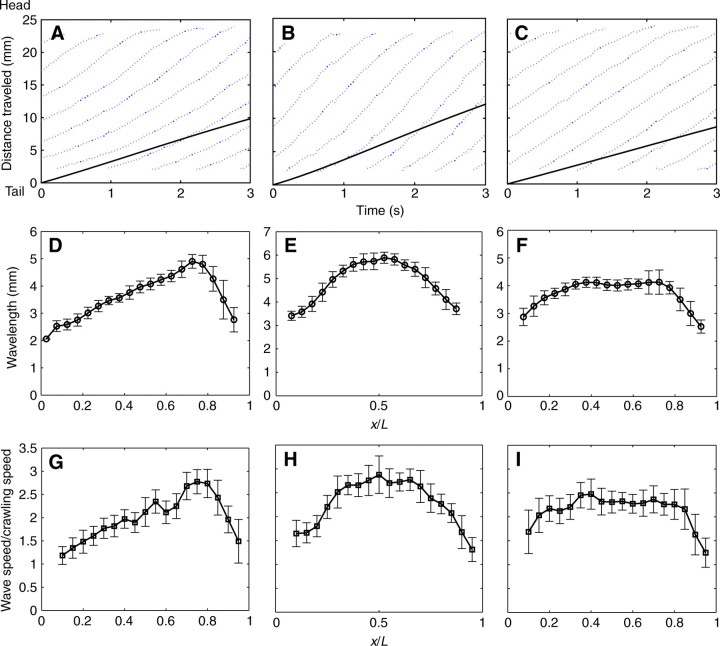
Representative patterns of wave propagation in garden slugs. (A–C) Time evolution of the displacement of the waves (dotted lines) compared with the overall displacement of the centroid of the animal (solid black lines), (D–F) wavelength variation along the animal's foot represented as the distance from the tail normalized by the length of the animal, x/L (means ± s.d.) and (G–I) wave speed along the animal's foot normalized by the speed of the crawling and represented as a function of x/L (means ± s.d.). Three wave-progression patterns were identified: (1) acceleration of pedal waves (A,D,G), (2) symmetric acceleration and deceleration (B,E,H) and (3) constant wave speed along the animal (C,F,I). Each column represents data collected from an individual garden slug.

