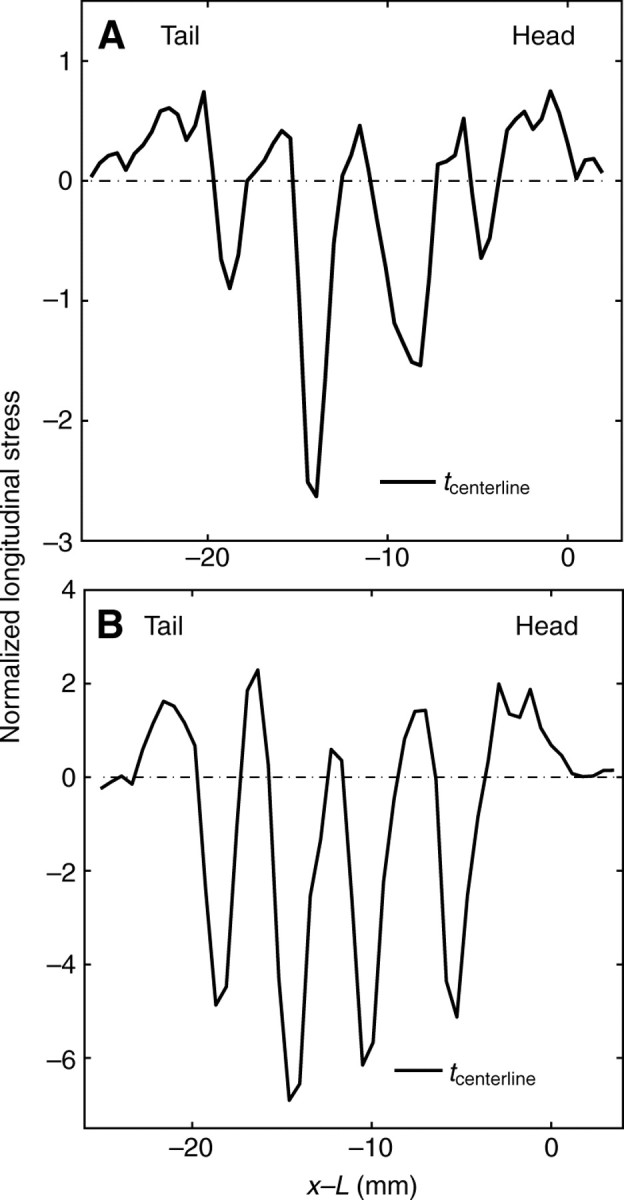
Fig. 18.

Horizontal stresses generated by the animals shown in Figs 12 and 16 along their direction of motion, measured along the centerline of their ventral feet (tcenterline) and represented as a function of the distance to their heads. (A) Garden slug in panels A, C and E of Fig. 12; (B) garden snail in panels B, D and F of Fig. 16. Stresses were normalized by the vertical stresses produced by the animal's weight in order to allow comparison between animals. Stress oscillated from positive to negative peaks along the animal, indicating regions of waves and interwaves, respectively. In both animals, the stress magnitudes of the interwave regions (negative peaks) were significantly higher than those of the pedal wave regions (positive peaks). Dot–dash lines indicate the baseline, zero stress level.
