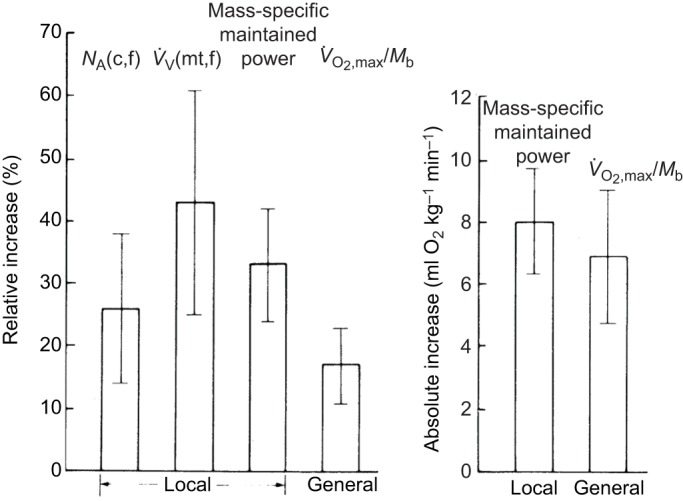
Fig. 2.

Muscle ultrastructure, leg performance and whole-body adaptations to endurance training in adults. (A) Comparison of changes in capillary density [NA(c,f)], volume density of mitochondria [V̇V(mt,f)], mass-specific maintained power, and mass-specific maximal O2 consumption (V̇O2,max/Mb). (B) Comparison of the absolute increases in mass-specific maintained power and V̇O2,max/Mb. Error bars indicate ±95% confidence intervals. From Hoppeler et al. (1985), reprinted with permission from the American Physiological Society.
