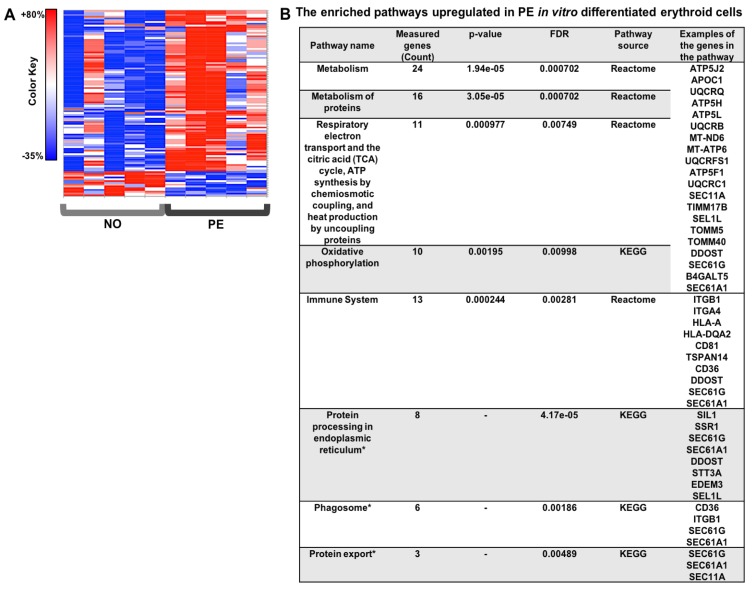
Figure 3.
The proteomics analysis heat map and the enriched pathways in the in vitro differentiated erythroid colonies. (A) The heat map for the significantly differentially expressed proteins in PE (n = 5) vs. normotensive (n = 5) in vitro differentiated erythroid cells. (B) The enrichment analysis in the gene set analysis in CPDB human network was performed based on the protein average fold ratio in PE and normotensive samples.

