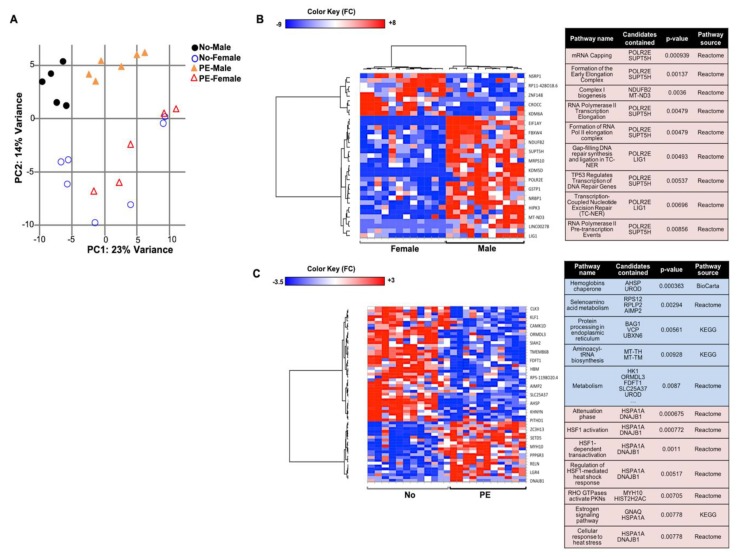
Figure 5.
Primary gene expression analysis of the UCB erythroid progenitors. (A) A distinct clustering was observed between male and female samples in the principal component analysis (PCA) plot. Also, among the PE (n = 6) and normotensive (n = 7) samples, a clearer clustering was observed in the male compared to female fetuses. The heat maps of the differentially expressed genes and the related pathways are presented when comparing (B) male vs. female and (C) PE vs. normotensive samples. Shades of blue and red indicates down- or up-regulated genes/pathways, respectively.

