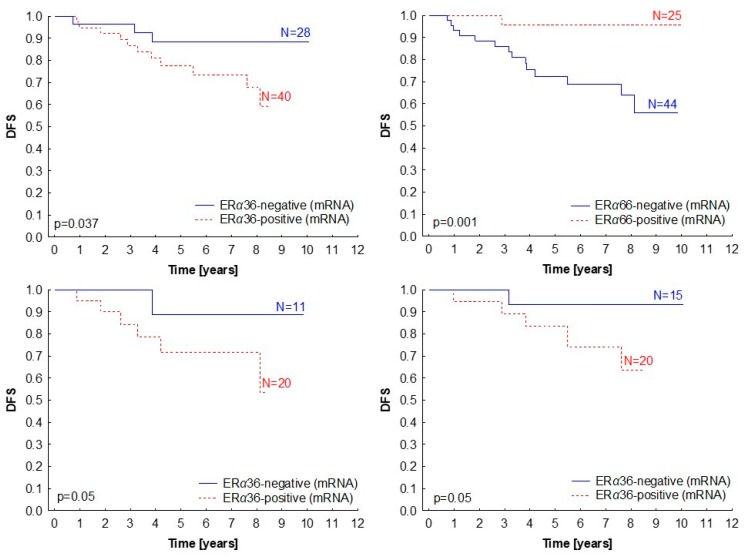
Figure 7.
Kaplan–Meier survival curves presenting disease-free survival (DFS) according to ERα36 (A) and ERα66 (B) mRNA levels (measured by qPCR) in primary breast tumors. (C,D) Subgroup analysis for ERα36 expression in ERα66 protein-negative (p = 0.05) (C) and positive (D) patients (p = 0.05). Median relative gene expression was a cut-off value for the classification of samples into negative and positive.

