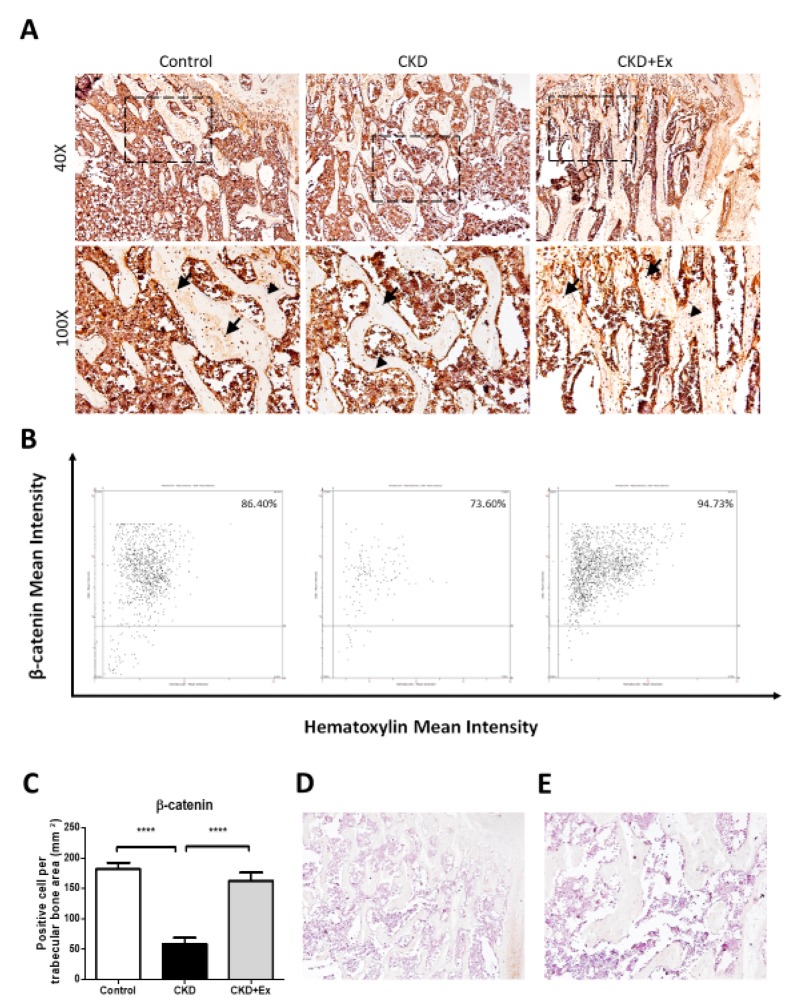
Figure 4.
β-catenin immunohistochemistry on osteocytes in the tibial trabecular bone. (A) Protein expression of β-catenin in the trabecular bone of rats was determined by IHC assay. Rats from the CKD + exercise group showed a higher β-catenin staining signal on osteocytes than in case of rats from the CKD group. The arrows indicate the positive cells. The arrowheads indicate the negative cells. (B) Representative images of tissue cytometry using HistoQuest software. β-catenin-immunoreactive (IR) positive and negative cells were counted and the signal intensity was quantified. (C) Images are representative and quantification data are presented as the mean ± SD from 5 rats in each group. The CKD group showed a significant difference compared to the CKD + exercise and sham groups (**** p < 0.0001). The CKD + exercise group showed no significant difference compared to the sham group. The analysis was performed using the One way-ANOVA test. (D) 40× and (E) 100× images of the negative control without primary antibody.

