Figure 12.
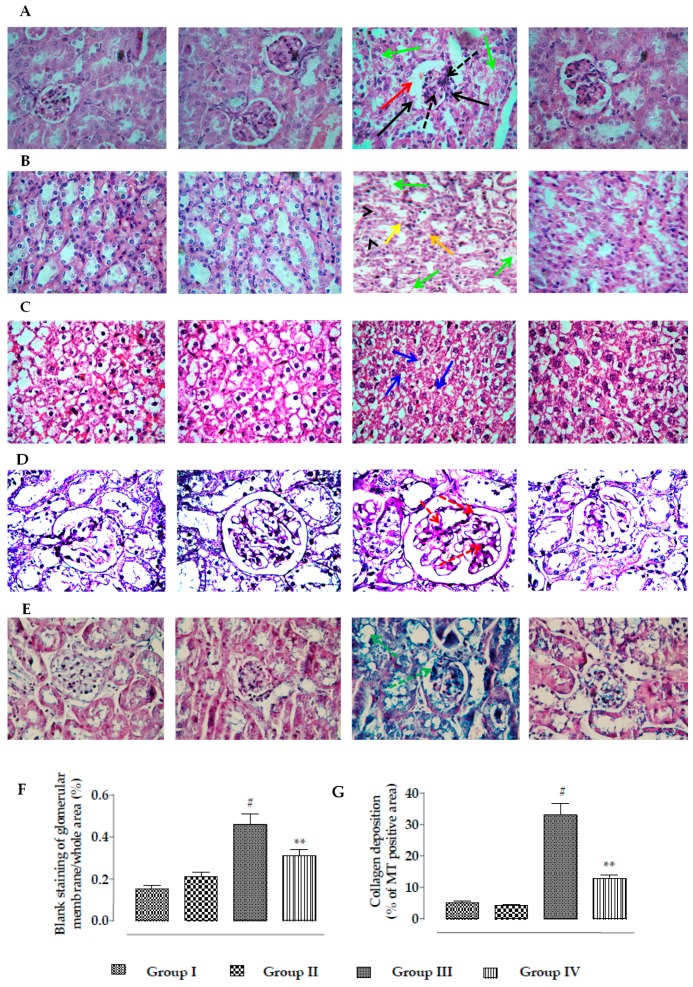
Histological assessments of kidneys of experimental mice in the absence (CdCl2) and presence of RA (CdCl2 + RA). (A) The H&E-stained sections of mice kidneys (×100), (B) H&E-stained medulla portion of mouse kidney, (C) H&E-stained cellular structure (×400) of mouse kidney, (D) PAS-stained sections of mice kidneys (×100), and (E) MT-stained sections of mice kidneys (×100). Red arrows indicate thickening of Bowman’s capsules; green arrows indicate cloudy appearance of tubules; arrow heads indicate degeneration of tubules; yellow arrows indicate vacuolation; black arrows indicate glomerular fibro-cellular crescent; black dotted arrows indicate mesangial hypercellularity; blue arrows revealed induction of apoptosis to the renal cells; red dotted arrows indicate glomerular mesangial matrix expansion; green dotted arrows indicate collagen deposition. (F) The widening of capsular space is shown as a percentage of the blank staining of glomerular membrane compared to the whole area of the photomicrograph (100×, arbitrarily selected areas containing one glomerulus). (G) Histo-quantification of collagen deposition in MT-stained kidney sections. Results are expressed as means ± SD (n = 30). # Values significantly (p < 0.01) differ from normal control. ** Values significantly (p < 0.01) differ from CdCl2 control.

