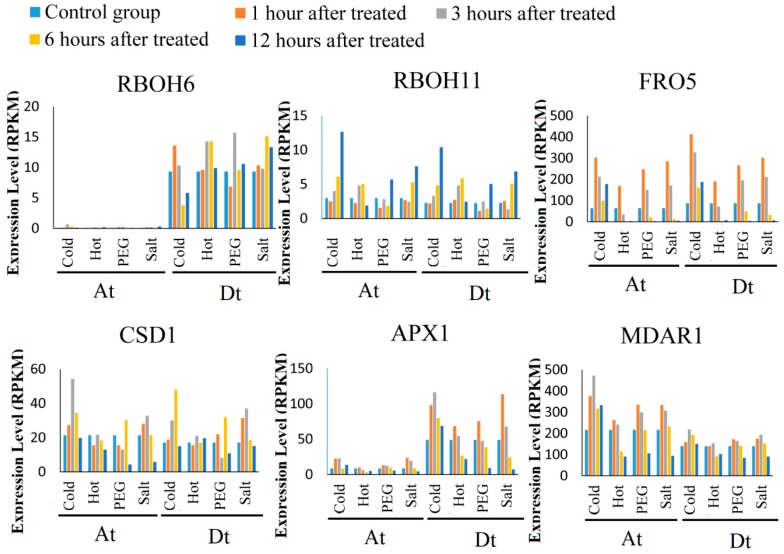
Figure 5.
Expression of ROS Network genes in G. arboreum, G. hirsutum, and G. raimondii under abiotic stress. Expression level obtained from RNA-seq data and was show with RPKM (Reads per Kilobase of exon model per Million mapped reads). (A) The expression of RBOH6/RBOH11 and FRO5 orthologous gene pairs. (B) The expression level of CSD1, APX1, and MDAR1 orthologous gene pairs.

