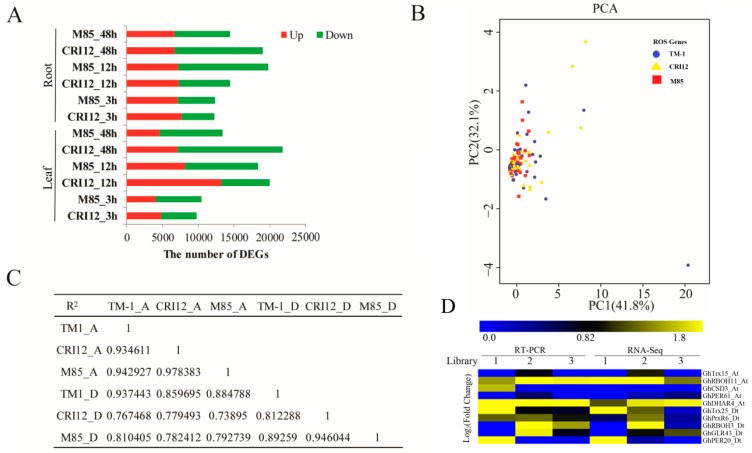
Figure 7.
RNA-Seq analyses and RT-qPCR validation of the ROS network genes in M85 and CRI12 under alkali-salt stress. (A) The number of differentially expressed genes (DEGs) of G. hirsutum races marie-galant (M85) and G. hirsutum cultivar (CRI12) under complex alkali-saline stress at 3, 12, and 48 h. Red block is up-regulated DEGs. Green block is down-regulated DEGs. (B) PCA (principal component analysis) plot of the first two components for genes of ROS network. The dot color scheme represents different cotton accession (TM1, red; M85, yellow; CRI12, blue.). (C) Correlation coefficients of TM-1, CRI12, and M85. (D) RT-qPCR analysis of selected ROS genes, 1, 2, and 3 refers to the libraries, yellow-upregulated, blue: down-regulated, and black: no expression.

