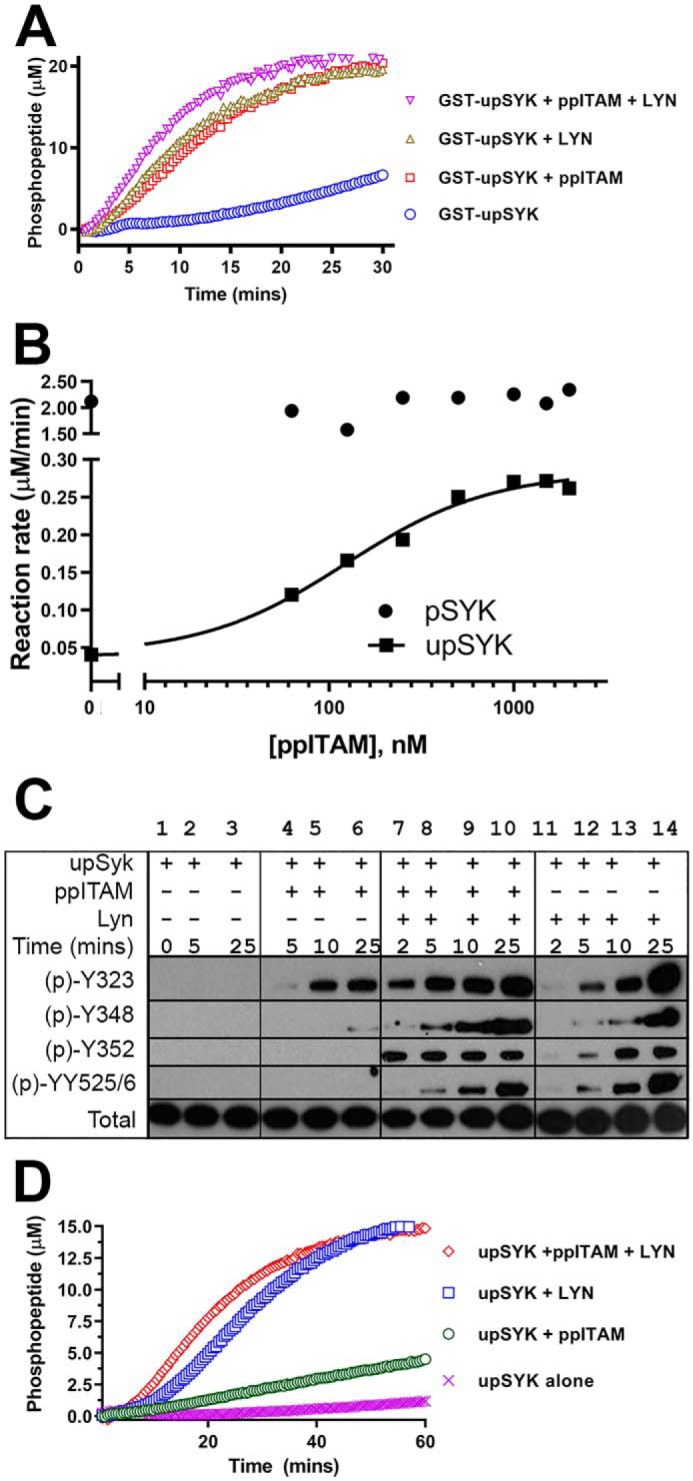
Figure 3.

ppITAM- and LYN-mediated activation of SYK isoforms. A, kinetic profiles of Omnia kinase reactions of GST-upSYK alone (blue circles), GST-upSYK + ppITAM (red squares), GST-upSYK + LYN (green triangles), and GST-upSYK + ppITAM + LYN (pink inverse triangles) are shown. Enzyme (4 nm), ATP (35 μm), and peptide (10 μm) concentrations were kept constant in all four reactions. B, effect of increasing concentrations of ppITAM on the rate of upSYK or pSYK phosphorylation of Omnia S/T peptide 7. Reagent concentrations were 25 nm of each SYK protein, 35 μm ATP, and 10 μm Omnia peptide. The solid line represents a fit to the 4-parameter logistic equation using the no ppITAM rate to define the minimum. The maximum, Hill slope, and EC50 values were floated to obtain the best nonlinear least squares fit to the equation. C, Western blots (region migrating at 65–80 kDa) showing a time course of site-specific SYK tyrosine phosphorylation in the presence or absence of ppITAM and/or LYN. Reaction conditions are described under “Experimental procedures.” Lane 1 corresponds to a negative control reaction, which was immediately quenched. Phosphorylation signals were also shown for upSYK alone (lanes 2 and 3), upSYK + ppITAM (lanes 4–6), upSYK + ppITAM + LYN (lanes 7–10), and upSYK + LYN (lane 11-14). D, kinetic data were acquired identically to that in A except GST-upSYK was replaced with upSYK, and their respective kinetic profiles are as follows: upSYK alone (pink crosses), upSYK + ppITAM (green circles), upSYK + LYN (blue squares), and GST-upSYK + ppITAM + LYN (red diamonds) are shown. Enzyme (4 nm), ATP (35 μm), and peptide (10 μm) concentrations were kept constant in all four reactions.
