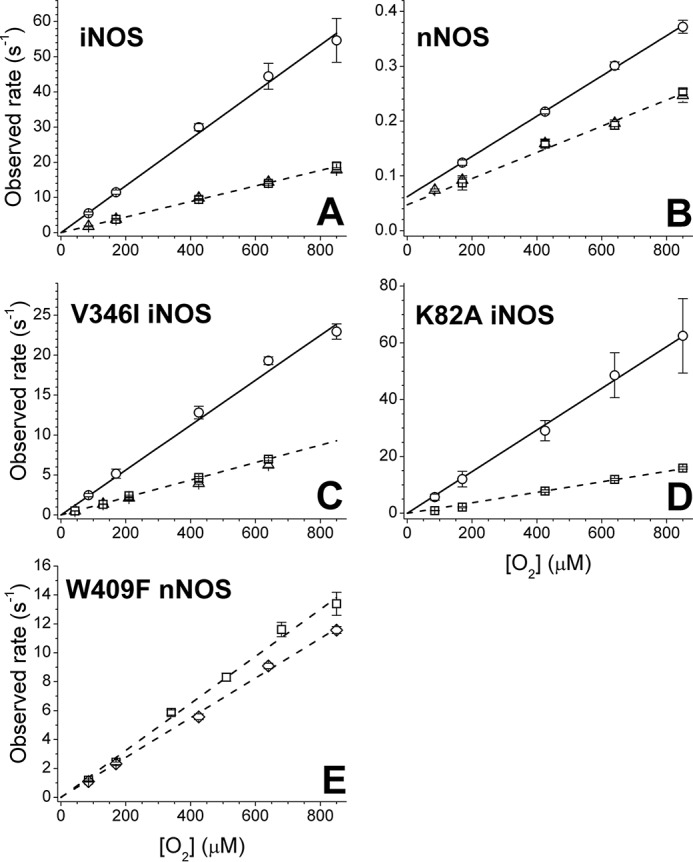
Figure 3.

Dependence of the observed ferrous heme-NO oxidation rates versus oxygen concentration in the presence or absence of l-Arg and H4B. A, WT iNOSoxy; B, WT nNOSoxy; C, V346I iNOS; D, K82A iNOS; E, W409F nNOS. Points indicate the averaged observed rates calculated at single wavelengths for FeII-NO decay (around 436 nm) and FeIII buildup (around 396 nm). The substrates are as follows: −H4B, +l-Arg (circles); +H4B, +l-Arg (squares); and +H4B, −l-Arg (triangles). For nNOSoxy W409F, the rates in the presence of both H4B and l-Arg at pH 7.6 (squares) and pH 9.5 (diamonds) are shown. Lines indicate linear fits for the rates in the presence of only l-Arg (solid lines) or in the presence of both H4B and l-Arg (dashed lines). The fits for +H4B-only experiments (triangles) are almost identical to the experiments in the presence of both H4B and l-Arg and are not indicated.
