Figure 4.

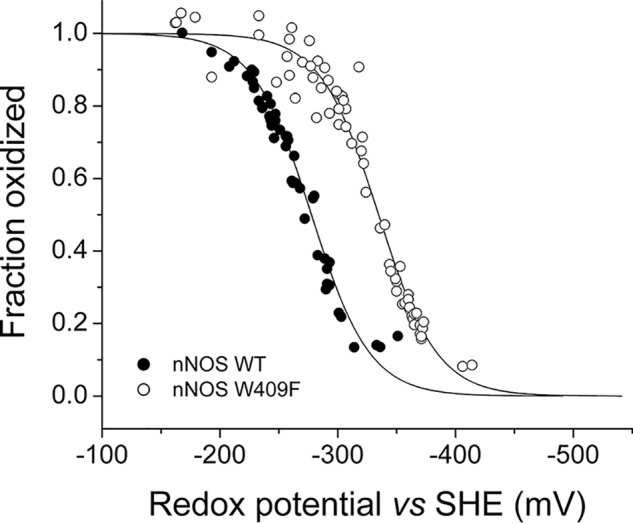
Potentiometric redox titration of WT and W409F nNOS oxygenase domains. The data are presented as the measured potential (E) versus the fraction oxidized. The solid lines represent the fit of the theoretical one-electron Nernst equation.

Potentiometric redox titration of WT and W409F nNOS oxygenase domains. The data are presented as the measured potential (E) versus the fraction oxidized. The solid lines represent the fit of the theoretical one-electron Nernst equation.