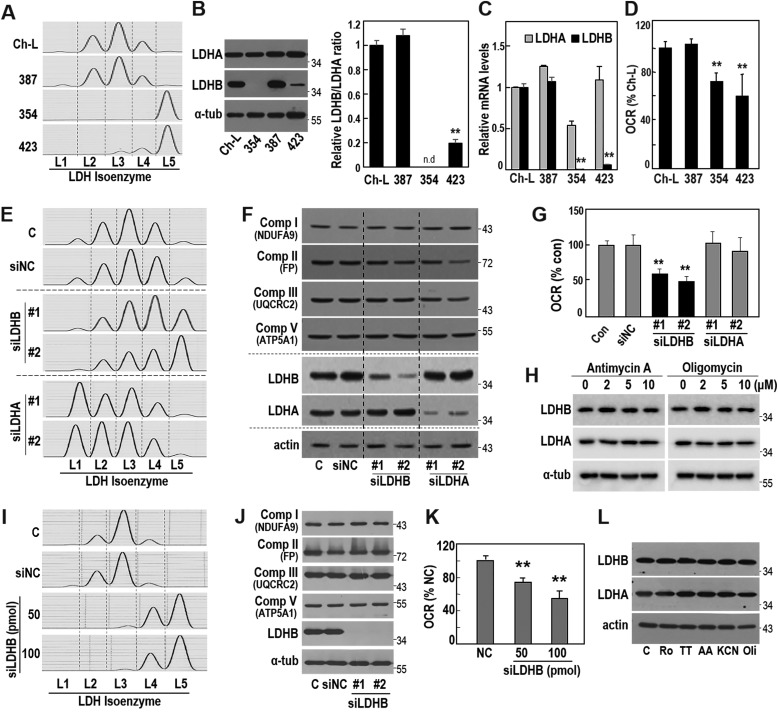
Figure 1.
LDHB suppression decreases cellular oxygen consumption rate. A–D, three different SNU hepatoma cell lines (SNU387, SNU354, and SNU423) and a Chang cell clone (Ch-L) were cultured for 2 days to maintain exponentially growing state and subjected to each experiment. A, LDH isozyme assay was performed as described under “Experimental procedures.” B, LDHA and LDHB expressions were assessed by Western blotting analysis using whole-cell lysates (left panel). Quantification of the protein levels is shown as a ratio of LDHB to LDHA (right panel). LDHB protein level of SNU354 was not detected (n.d.). **, <0.01 versus Ch-L. C, mRNA levels of LDHA, LDHB and actin were analyzed by qRT-PCR. mRNA levels of LDHA and LDHB were normalized by mRNA level of actin. **, <0.01 versus Ch-L. D, endogenous cellular oxygen consumption rate (OCR) was measured. **, <0.01 versus Ch-L. E–G, SNU-387 cells were transfected with siRNA for LDHB (siLDHB) and LDHA (siLDHA) for 3 days. E, LDH isozyme assay. F, protein expression levels of the indicated targets were analyzed by Western blotting analysis. G, endogenous cellular oxygen consumption rate. **, <0.01 versus control. H, SNU387 cell was exposed to the indicated concentrations of antimycin A (left panel) and oligomycin (right panel) for 12 h. LDHA and LDHB expressions were examined by Western blotting analysis. I–K, Ch-L cells were transfected with the indicated amounts of LDHB siRNA for 3 days. I, LDH isozyme analysis. J, Western blotting analysis. K, endogenous cellular oxygen consumption rate. **, <0.01 versus negative control (NC). L, Ch-L cells were treated with 10 μm rotenone (Ro, complex I inhibitor), 400 μm TTFA (TT, complex II inhibitor), 10 μm antimycin A (AA, complex III inhibitor), 10 mm KCN (complex IV inhibitor), or 10 μm oligomycin (Oli, complex V inhibitor) for 12 h. Western blotting analysis. C or Con, control.

