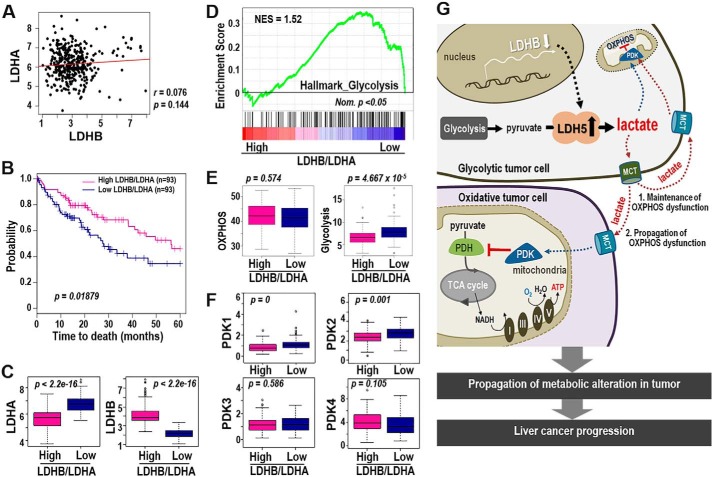
Figure 6.
LDHB/LDHA ratio is a good prognostic indicator of LIHC harboring mitochondrial dysfunction. A–F, bioinformatics analysis from TCGA_LIHC data set. A, association analysis of LDHA and LDHB expression in LIHC tumors. B, Kaplan–Meier survival analysis of high and low LDHB/LDHA groups was performed (see “Experimental Procedures”). The statistical p value was generated by the Cox–Mantel log-rank test. C, box plot shows expression levels of LDHB (right panel) and LDHA (left panel) of high- and low-LDHB/LDHA group. The p value was calculated based on the Welch two-sample t test. D, enrichment plot from GSEA output based on the gene set of HALLMARK_GLYCOLYSIS (n = 200) is shown. Normalized enrichment score (NES) and nominal p value (Nom. p) are shown. E, single sample GSEA was performed based on the gene sets derived from HALLMARK_OXIDATIVE_PHOSPHORYLATION (n = 200) and HALLMARK_GLYCOLYSIS (n = 200) (MSigDB_V6.1). The p value from the Kolmogorov–Smirnov test was transformed in −log scaled and used in the plot. F, expression levels of PDK1∼4 in high- and low-LDHB/LDHA tissue types were plotted. p value was calculated based on the Welch two-sample t test. G, schematic diagram for our hypothesis explaining the LDHB-mediated glycolytic control of OXPHOS dysfunction in LIHC.

