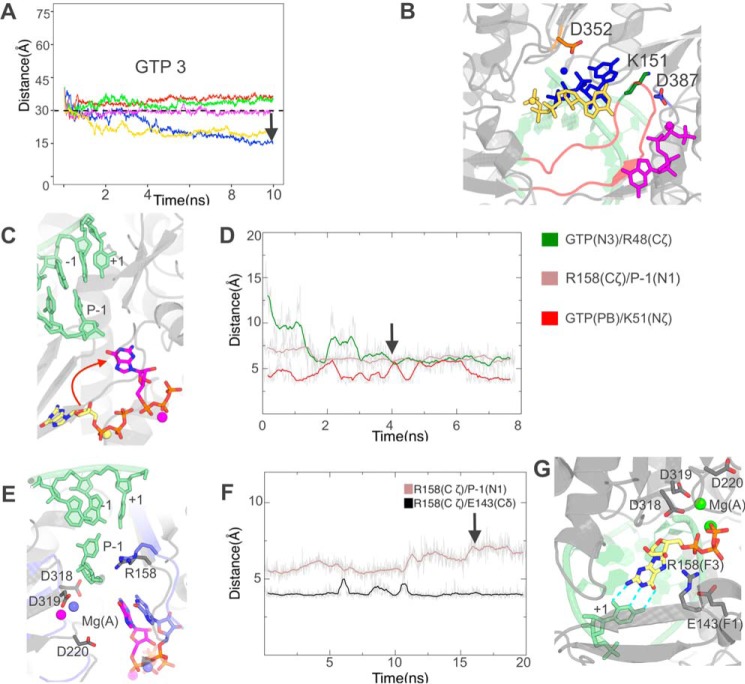
Figure 7.
GTP entry with a cytosine as the +1 base occurs through successive steps similar to those as UTP entry with an adenosine as +1 base. A and B, molecular dynamics simulations with distance restraints between the centers of masses of Asp319 and GTP starting from position 3. A, evolution of GTP distances from Asp319 during five 10-ns simulations with five energy constants 0 (no bias, red curve), 0.02 (blue), 0.05 (green), 0.1 (magenta), and 0.5 (yellow) Kcal/mol/Å2. The distance of 30 Å below which no extra energy term is added is indicated. The black arrow denotes the snapshot that was selected for further simulations. B, the three stable positions closest to Asp319 reached by GTP from initial position 3, colored according to the energy constant applied beyond 30 Å. C and D, accelerated molecular dynamics simulations show spontaneous GTP orientation at the NTP tunnel entry. C, positions of GTP at the start of simulations (yellow carbons) and at a stable position reached in two of five replicas (magenta carbons). D, evolution of relevant distances between GTP and residues lining the NTP tunnel in one such simulation. The black arrow denotes the snapshot that was selected for further simulations. E and F, simulation after addition of Mg(A) at the noncatalytic site. E, initial GTP position (magenta carbons for GTP and Arg158) superimposed on the snapshot (purple carbons) defined by the arrow in F. F, evolution of the same Arg158 distances as in Fig. 6B also show a reversal of Arg158 interactions with base P-1 unmasking, this time with no change in the interaction with Glu143. The black arrow denotes the snapshot that was selected for further simulations. G, after targeted molecular dynamics simulations, GTP preinsertion is established.

