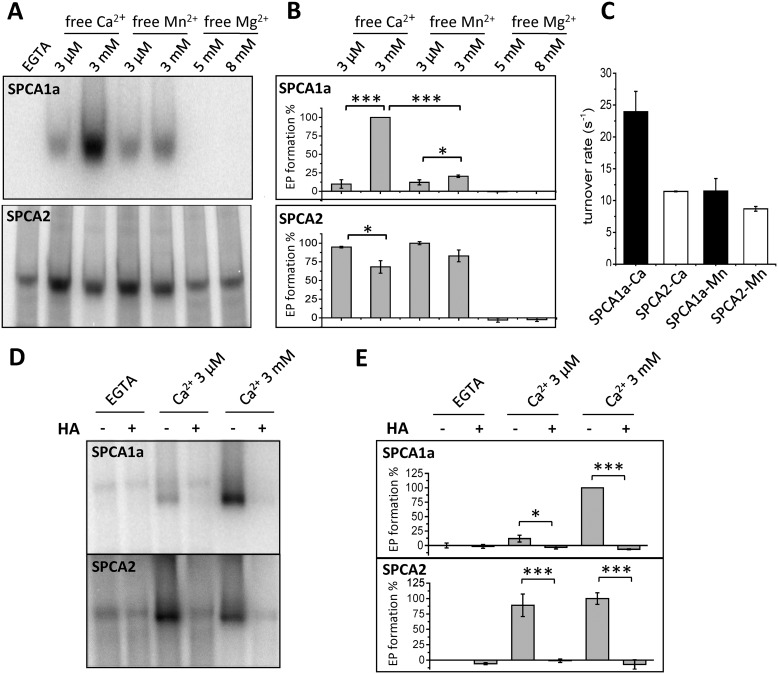
Figure 3.
Comparison of the Ca2+-, Mn2+-, or Mg2+-induced autophosphorylation in SPCA1a and SPCA2. A, phosphorimages of the radiolabeled SPCA1a (upper) and SPCA2 (lower) phospho-intermediates (EP) separated by gel electrophoresis. Indicated concentrations of Mn2+ or Ca2+ were supplied in the presence of 5 mm MgCl2. In the Mg2+ conditions, only 5 or 8 mm MgCl2 was administered. B, bar graphs depicting the EP levels in various conditions. The radioactivity was quantified with ImageJ software and the EGTA signal was subtracted as background. C, bar graph depicting the turnover rates of both isoforms. Turnover rates were calculated by dividing the maximal ATPase activities over the maximal phosphorylation activities (n = 3). D, representative phosphorimages of SPCA1a or SPCA2 treated with radiolabeled ATP followed by administration of HA, a quencher of aspartyl-phosphate intermediates. Experiments were conducted in the presence of EGTA, 3 μm or 3 mm Ca2+ (n = 3). E, quantification of radioactivity in D was performed using ImageJ software. One-way ANOVA was performed followed by post hoc Bonferroni test. *, p < 0.05; **, p < 0.01; ***, p < 0.001.

