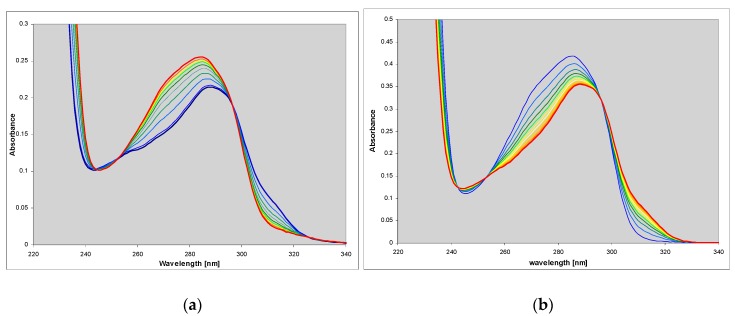
Figure 1.
Spectral changes observed during (a) the enzymatic ribosylation of 1,N2-ethenoguanine (1) with 0.5 mM R1P, in HEPES buffer, pH 7.3, catalyzed by purine-nucleoside phosphorylase (PNP) from E. coli; (b) enzymatic phosphorolysis of 1,N2-ethenoguanosine by the same enzyme in 50 mM phosphate buffer, pH 7. The time interval is 5 min. Final curves are drawn in red.

