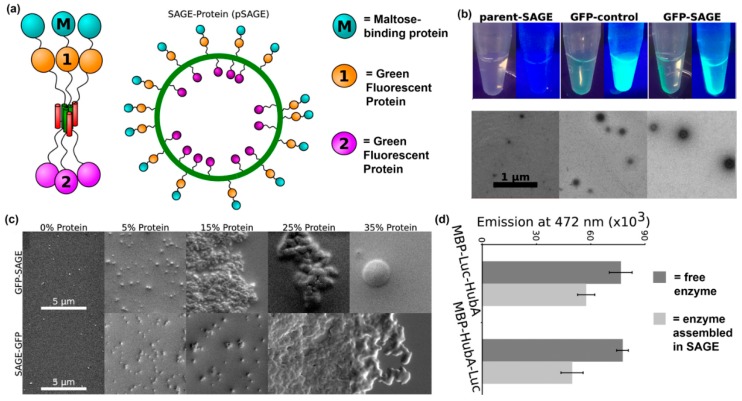
Figure 9.
Self-assembled cages displaying protein domains. (a) Schematic representation of a cage formed from self-assembling peptide–protein conjugates. Proteins can be displayed within the core or on the surface of the cage using this methodology. (b) Representative fluorescence still images and transmission electron microscopy images of assembled peptide–protein cages. Particles assembled in the presence of GFP fusion proteins were fluorescent. Particles with average diameters of ~100 nm and uniform morphologies were observed. (c) The average particle diameter depended on protein orientation. Slightly larger particles were obtained when proteins were conjugated on the outside of the particles. (d) Representative SEM images of assembled particles incorporating 0%, 5%, 15%, 25%, and 35% (volume ratio) peptide–protein conjugates. Individual particles were observed below 15% protein loading, while aggregation occurred at higher concentrations. (e) Bioluminescence emission at 472 nm from 5% Renilla luciferase assembled into cages (light gray) or free in solution (dark gray). Differences between assembled and soluble enzyme were insignificant. Adapted with permission from [111]. Copyright 2017, American Chemical Society publishing.

