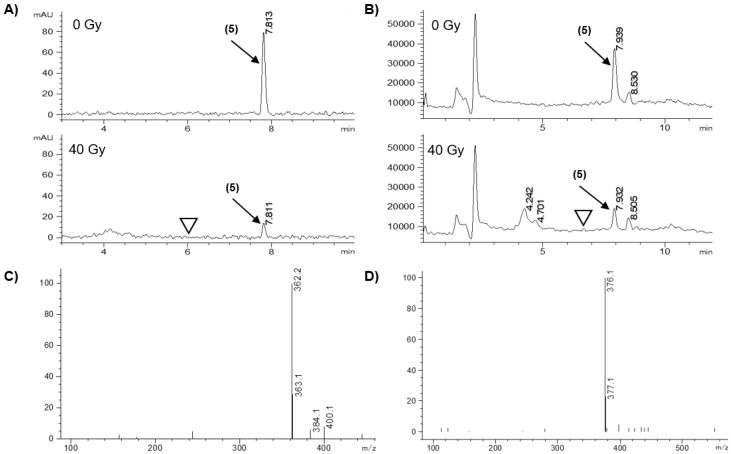
Figure 4.
LC/MS analysis of the radiolytic reduction of model HAP 5. (A) Diode array chromatograms at 276 nm (bandwidth 16 nm), with 0 and 40 Gy. (B) Total ion chromatograms (positive mode, scanning m/z 100–600), with 0 and 40 Gy. (C) Mass spectrum of peak at retention time 4.701 min (identified as hydroxylamine). (D) Mass spectrum of peak at 7.932 min (identified as prodrug by comparison with authentic 5). ▽ Indicates the retention time of the parent PARPi 4.

