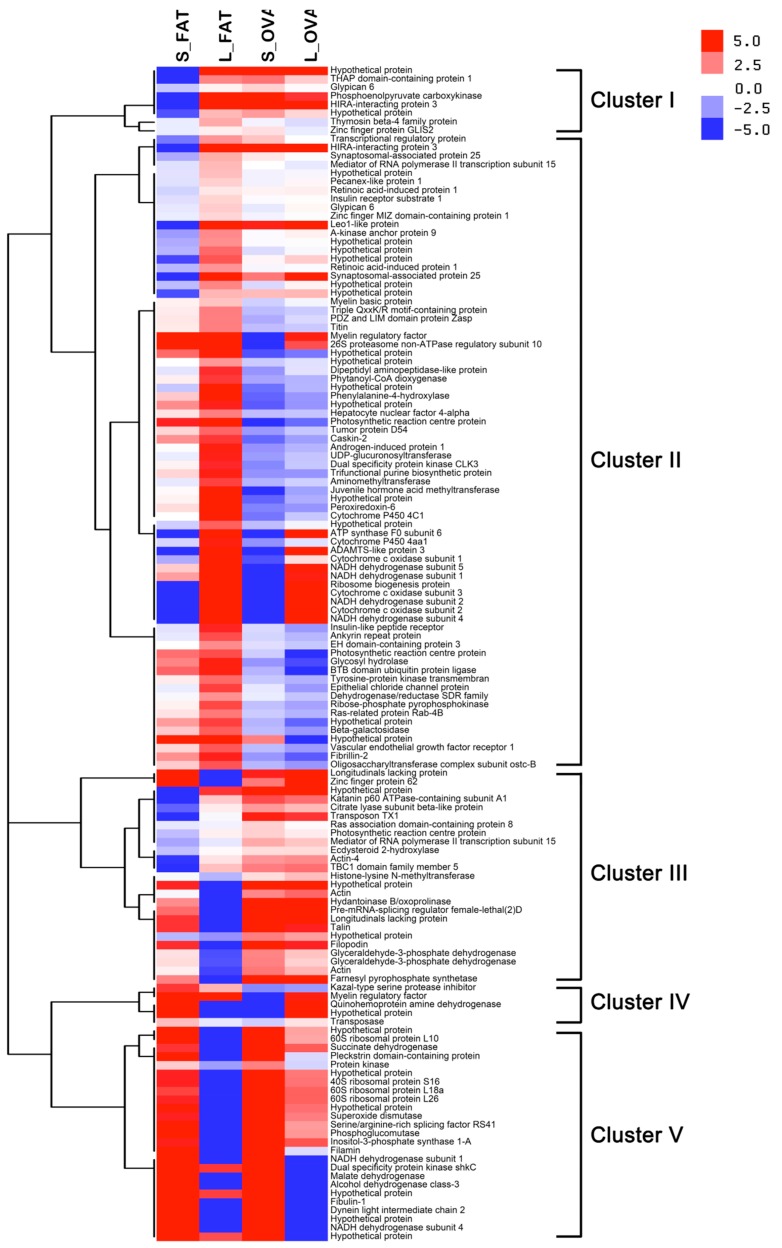
Figure 2.
Heatmap of DEGs across the four treatments. Each line in the figure represents a gene, with the columns representing S_FAT, L_FAT, S_OVA and L_OVA. Red indicates relatively high expression and blue indicates relatively low expression. All of the DEGs fall in the range of ±5.0. The spectrum of color from red to blue, indicating that log10 (FPKM + 1) has flow from large to small.

