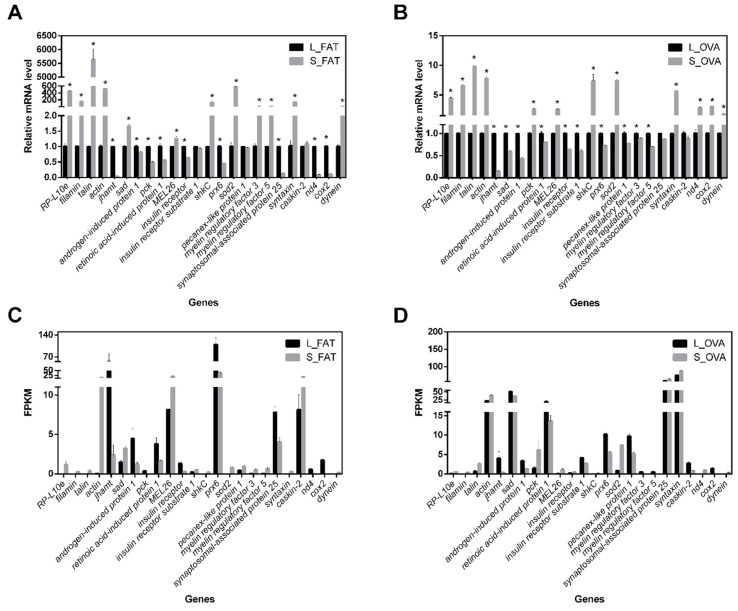
Figure 3.
qRT-PCR validations of 24 DEGs in FAT and OVA groups. (A) Relative mRNA level of 24 DEGs in FAT group. (B) Relative mRNA level of 24 DEGs in OVA group. (C) FPKM value of 24 DEGs in FAT group. (D) FPKM value of 24 DEGs in OVA group. For each DEG, three technical replications were performed; ef-1 gene was used as internal control. For each treatment, three replications were performed. Values were reported as mean ± SE. * Indicates an error probability of p < 0.05 using Student’s t-test.

