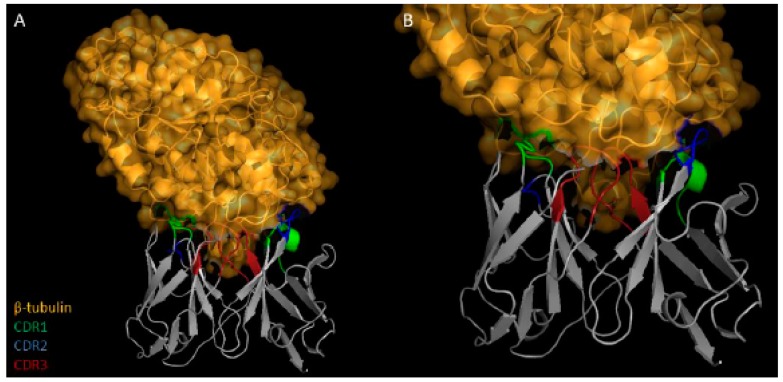
Figure 5.
Three-dimensional analysis of the interaction between antibodies and targeted protein. Results (A,B) showing the regions of interaction between the scFv E8 (gray) and β-tubulin (orange) are shown, as well as structures from CDR regions of the scFv antibodies associated to β-tubulin protein are shown.

