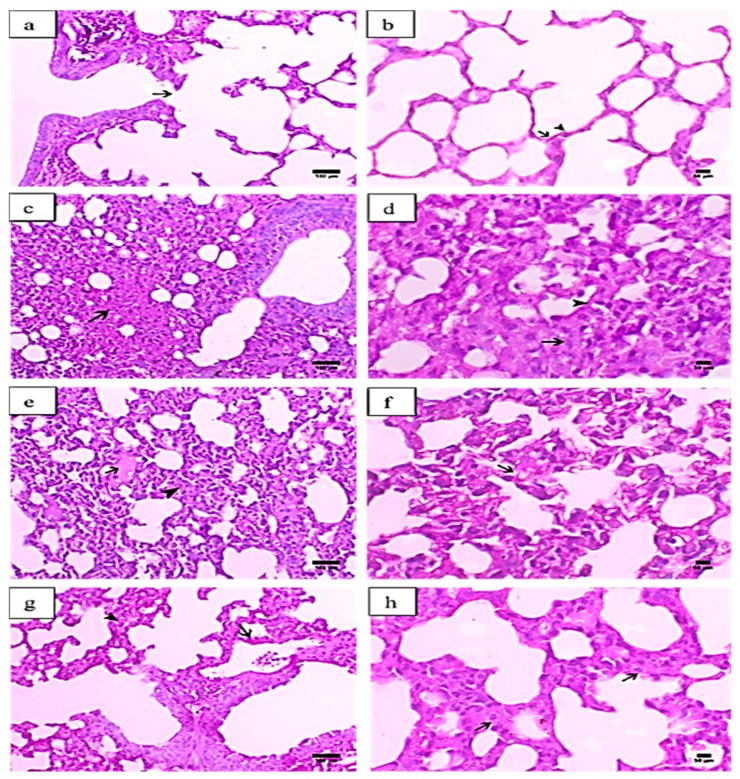
Figure 1.
Histopathological graphs of lung sections from all groups. The lung sections were analyzed by hematoxylin and eosin (H&E) staining. Control group (a,b): (a) indicated normal terminal bronchiole ended with respiratory portion (arrow) (X200, scale bar = 100 µm), (b) showed alveoli lined with alveolar epithelial cells pnemocyte type I (arrow) and type II (arrowhead) (X400, scale bar = 50 µm). Paraquat (PQ) group (c,d): (c) presented necrosis in the alveolar tissue (arrow) (X200, scale bar = 100 µm), (d) showed excessive interstitial tissue thickening associated with septal cell proliferation (arrow) and alveolar hyaline membrane formation (arrowhead) (X400, scale bar = 50 µm). PQ + MEL (melittin) (0.1 mg/kg) group (e,f): (e) illustrated mild focal serous exudate within the alveoli (arrow) accompanied with a moderate degree of inter-alveolar interstitial tissue thickening (arrowhead) (X200, scale bar = 100 µm) (f) presented a moderate degree of thickening in the inter-alveolar septa and marked hyperplasia of pneumocyte type II in the lining epithelium (arrow) (X400, scale bar = 50 µm). PQ + MEL (0.5 mg/kg) group (g,h): (g) displayed decrease in the inter-alveolar thickening (arrowhead) with marked hyperplasia of pneumocyte type II (arrow) (X200, scale bar = 100 µm) (h) presented a decrease in the inter-alveolar septa (arrowhead) with an increase in the alveolar spaces associated with hyperplasia of pneumocyte type II (arrow) (X400, scale bar = 50 µm).

