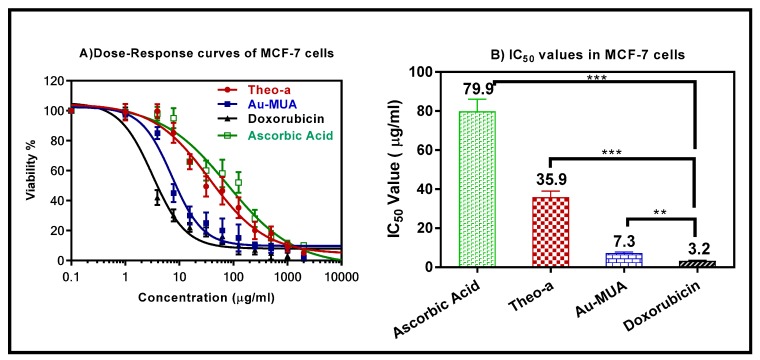
Figure 5.
Dose-response curve (A) and half maximal inhibitory concentration (IC50) values (B) of pheophytin a (pheo-a) in Michigan Cancer Foundation 7 (MCF-7) cells in comparison to doxorubicin, ascorbic acid, and gold coated mercaptoundecanoic acid (AU-MUA). All the values are expressed as mean ± standard deviation; n = 3, *** p < 0.001, and ** p < 0.01.

