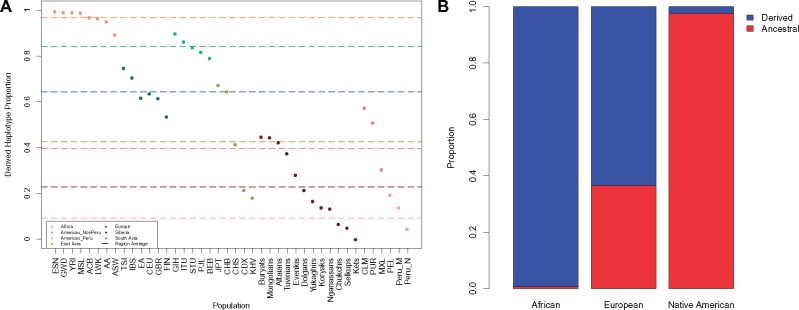
Fig. 1.
—FADS ancestral and derived haplogroup proportions in modern human populations. (A) Derived haplogroup proportion from all 1000 Genomes, Siberian, GeneSTAR African American (AA) and European American (EA) and Peruvian mestizo (Peru_M) and Native American populations (Peru_N). Dashed lines represent each geographic region’s average derived haplogroup proportion. Americas_NonPeru consists of the 1000 Genomes Native American ancestry populations and Americas_Peru represents the Peruvian Genome Project populations (Harris et al. 2018). (B) Ancestral (red) and derived (blue) haplogroup proportion in all local ancestry segments from the admixed 1000 Genomes Project populations, African and European Americans from GeneSTAR, and Peruvian Genome Project individuals with <99% Native American ancestry (Harris et al. 2018). (African = 505, European = 685, Native American = 386 haplotypes).

