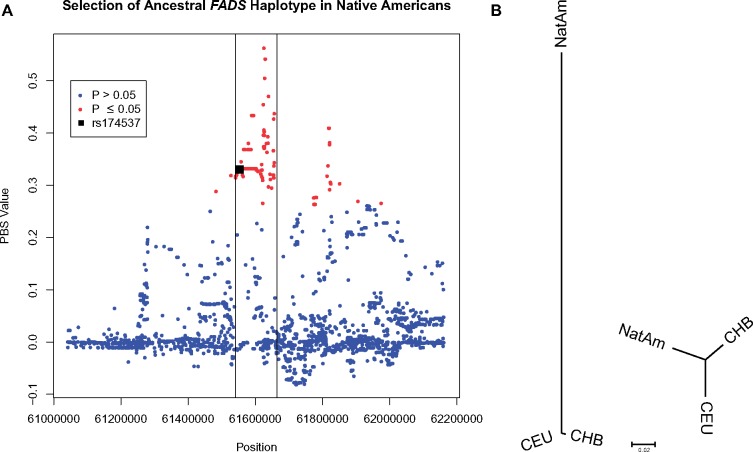
Fig. 2.
—Signatures of selection in the FADS region in Native Americans. (A) PBS values from chr11: 61,044,208–62,163,145. The black lines mark the FADS gene region and the black square represents the PBS value for rs174537 (P = 0.0001242) while red circles represent P values that are ≤ 0.05 and blue circles represent P values that are >0.05, after correction for multiple hypothesis testing. (B) Representation of rs174537 PBS values (left) and the genome wide average PBS values (right). Branch lengths are the PBS values for each population.

