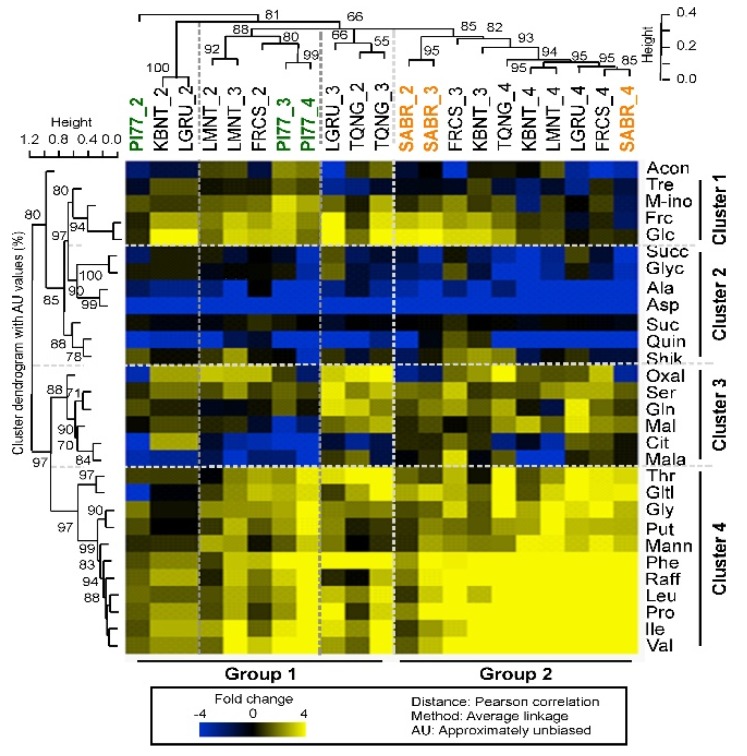
Figure 3.
Two-way hierarchical clustering heatmap of metabolic changes in response to different irrigation levels of seven rice cultivars. Metabolite ratios greater than 0 are in gradations of yellow up to 4-fold increase compared to IRRI_1 condition (see scale bar), ratios that are unchanged are shown in black and ratios less than 0 are in gradations of blue up to 4-fold decrease. Distance was determined by Pearson correlation coefficient. AU indicates approximately unbiased p-values (0–100%, with higher numbers denoting greater significance). Abbreviations of cultivars are for TQNG, Teqing; PI77, PI312777; LGRU, Lagrue; LMNT, Lemont; FRCS, Francis; SABR, Saber; KBNT, Kaybonnet. Cultivar names are followed by number depicting irrigation regime. Abbreviations of metabolites are for Acon, aconitate; Frc, fructose; Glc, glucose; myo-ino, myo-inositol; Tre, trehalose; Ala, alanine; Asp, aspartate; Succ, succinate; Glyc, glycerate; Quin, quinate; Shik, shikimate; Oxal, oxalate; Ser, serine; Gln, glutamine; Mal, maltose; Cit, citrate; Mala, malate; The, threonine; Gltl, galactinol; Phe, phenylalanine; Ile, isoleucine; Val, valine; Leu, leucine; Pro, proline; Raff, raffinose; Mann, mannitol; Gly, glycine; Put, putrescine.

