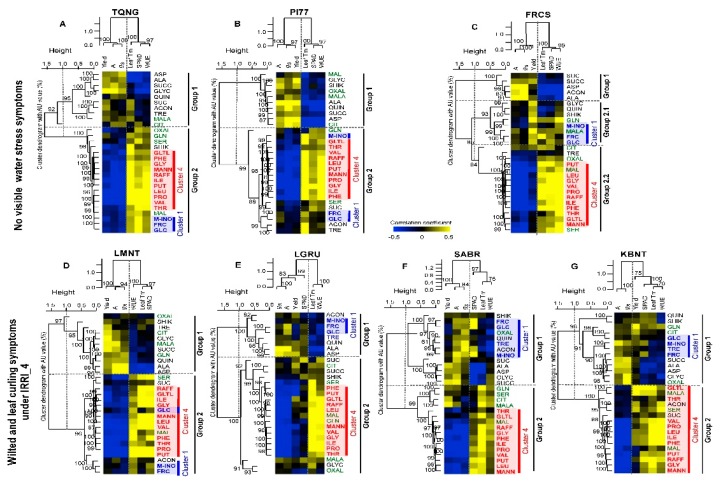
Figure 5.
Two-way hierarchical clustering heatmaps of metabolic changes in relation to physiological traits and yield. TQNG (A), PI77 (B), and FRCS (C) have no visible water stress symptoms while LMNT (D), LGRU (E), SABR (F), and KBNT (G) displayed wilted and leaf curling symptoms at IRRI_4. Values are correlation coefficients between each physiological trait (i.e., A, gs, relative chlorophyll content, leaf Tm, WUE (A/gs), and yield with metabolite contents. Metabolites in blue, green, and red are Cluster 1, 3, and 4, respectively as designated in Figure 3. Other details are as in Figure 3.

