Fig. 4.
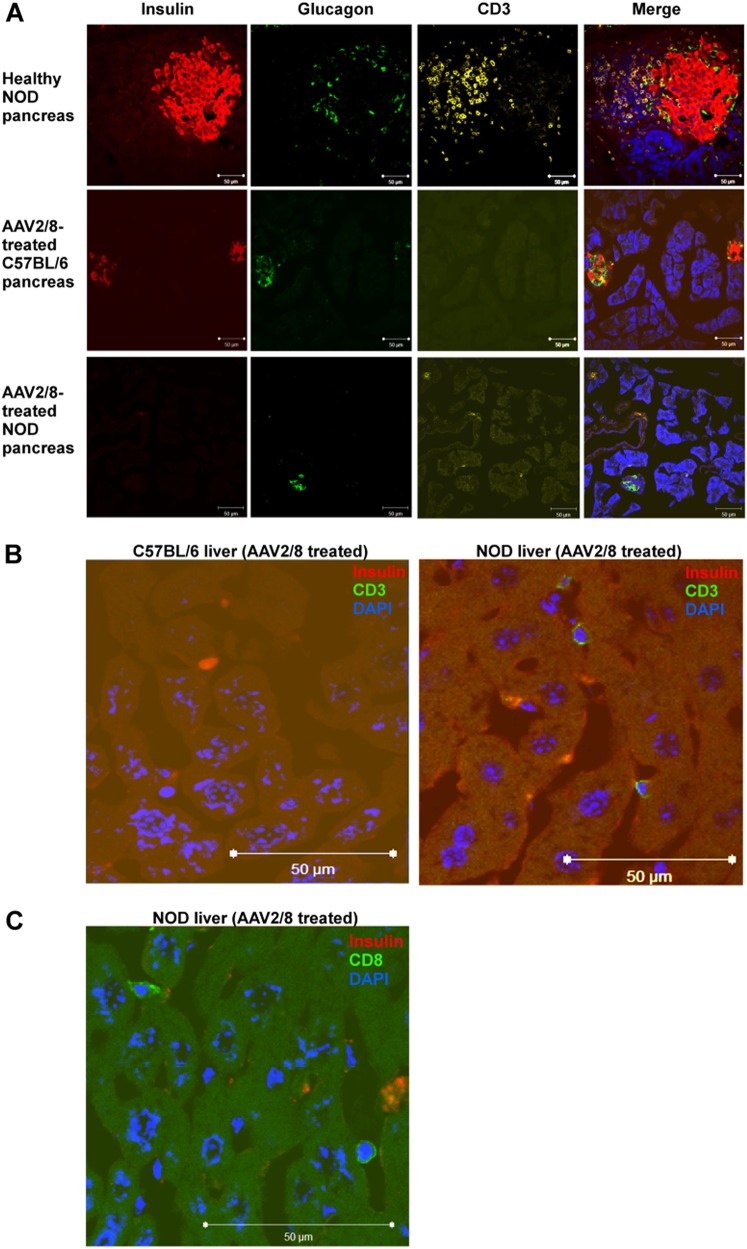
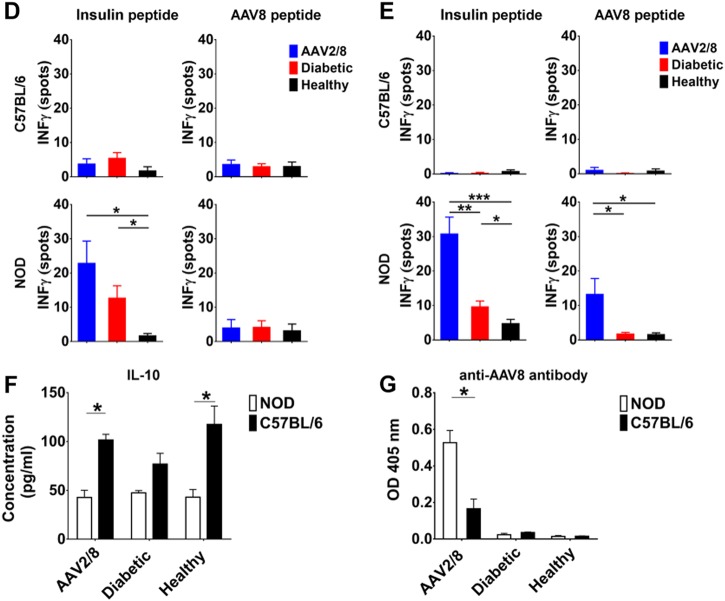
AAV2/8-insulin-based therapy elicits a cellular immune response against the vector and the transgene in NOD diabetic mice. Livers of NOD mice treated with AAV2/8-HLP-hINSco (indicated with AAV2/8) show signs of T cell infiltration observed in pre-diabetic NOD mouse pancreata. a Pancreas sections from a 8-week-old control NOD female pancreas (a, top panel), a 30-day AAV2/8-insulin-treated C57BL/6 (a, middle panel) and a 30-day AAV2/8-insulin-treated NOD (a, bottom panel) were stained for insulin (red) and glucagon (green), and CD3 (yellow) to show β-cell destruction in treated mice. b Livers from AAV2/8-HLP-hINSco -injected C57BL/6 (b, left) and NOD (b, right) mice were stained for insulin and CD3 to test for T cell infiltration. c Livers from AAV2/8-HLP-hINSco-injected NOD mice were stained for insulin and CD8. Blue shows nuclear DAPI staining. Scale bar 50 μm. d, e Ex vivo stimulated splenocytes from AAV2/8-HLP-hINSco -treated NOD mice and C57BL/6 controls for IFN-γ ELISPOT assay. Cells from NOD and C57BL/6 mice were harvested after 30 days (d) or more than 200 days (e) from the day of the injection of the AAV2/8-insulin vector. Cells were stimulated in vitro for 40 h with CD8+ immunodominant peptides (either InsB15–23 peptide for NOD or insulin Kb-restricted epitope A12–21 containing peptide for C57BL/6) or the AAV8 capsid-specific CD8+ T cell peptide NSLANPGIA and the number of resulting IFN-γ spots was counted with an ELISPOT reader. f Levels of anti-inflammatory cytokines in NOD mice compared to C57BL/6. Splenocytes from C57BL/6 and NOD mice were harvested at the end of a 30-day treatment with AAV2/8-HLP-hINSco 5 × 10⁹ vg and stimulated with PMA/Iono for 48 h. Supernatants were then collected and tested for IL-10 production. g Mouse anti-AAV8 ELISA performed on blood plasma of diabetic, healthy and 5 × 10⁹ vg AAV2/8-HLP-hINSco-treated NOD and C57BL/6 mice. Treated mice were tested for anti-AAV8 antibodies 30 days after the beginning of the therapy. The absorbances at 405 nm correlate with the concentration of the antibody. *(p ≤ 0.05), **(p ≤ 0.01), ***(p ≤ 0.001), unpaired Student’s t-test. Data shown are expressed as mean ± SE and are representative of two independent experiments


