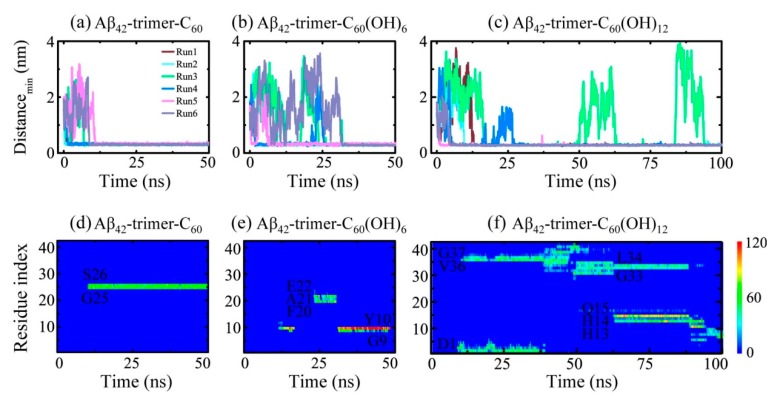
Figure 2.
Dynamics of the fullerene/fullerenol molecule binding to Aβ42-trimer. (a–c) Time evolution of the minimum distance between Aβ42-trimer and fullerene/fullerenol. Six independent molecular dynamics (MD) runs are denoted in different colors. (d–f) Time evolution of the number of contacts between individual residue of Aβ42-trimer and fullerene/fullerenol in a representative MD run for each simulated system.

