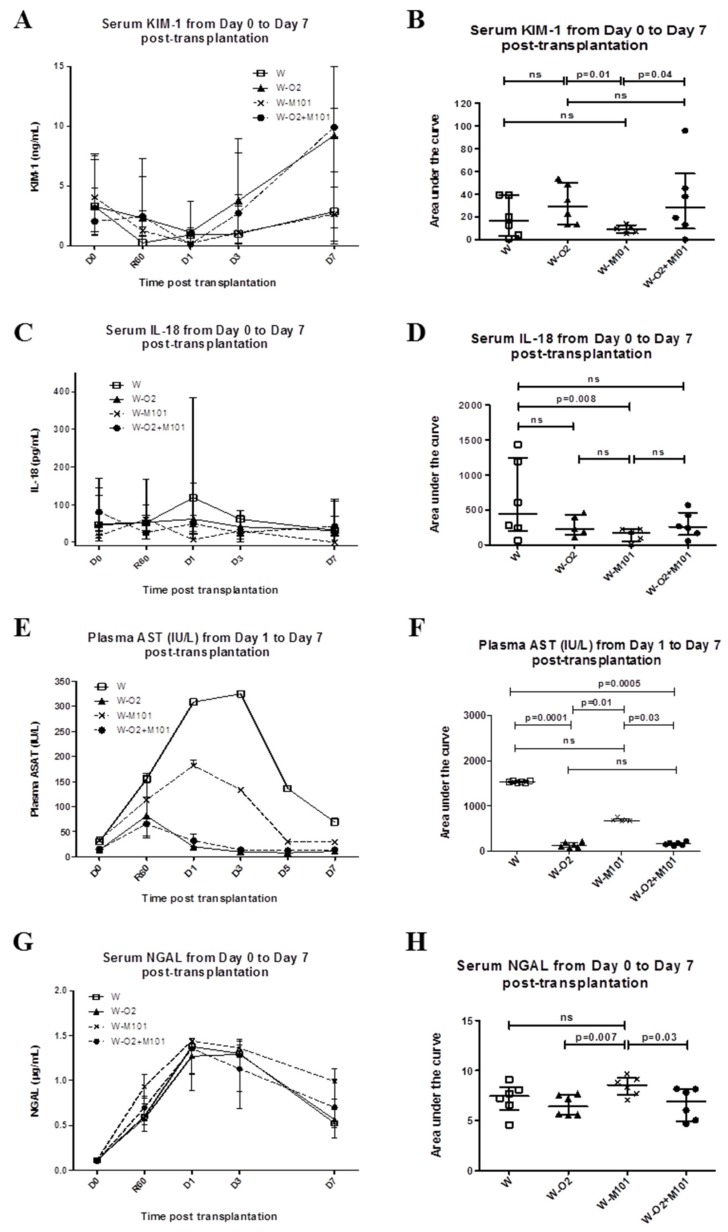
Figure 3.
Evaluation of kidney injury biomarkers from day 0 to day 7 post-transplantation. Evolution of serum KIM-1 level (A,B), IL-18 (C,D), plasma AST (E,F) and NGAL (G,H) in the different experimental groups during the first week of post-transplantation (Day 0 to Day 7). Results are expressed in the kinetic curve (A,C,E,G) and area under the curve (B,D,F,H). Results are expressed in median with interquartile range (IQR). Statistical analysis was performed with Kruskal-Wallis Multiple comparison Dunn’s test. n = 5–6/group.

