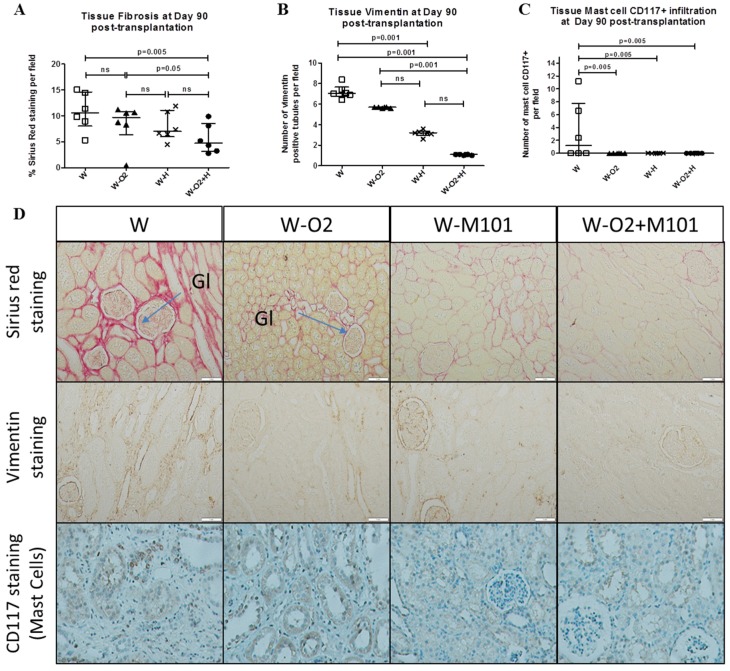
Figure 5.
Evaluation of histological kidney graft tissue at day 90 post-transplantation. Quantification of tissue fibrosis (A; % of Sirius Red staining/field), number of vimentin positive tubules (B) and mast cells infiltration (C; CD117 staining) at day 90 post-transplantation, in histological sections obtained from renal kidney cortices of different groups. Related representative images for each group (D) showing Sirius Red staining, vimentin staining and CD117 positive mast cells staining in cortex kidney graft tissue at day 90 post-transplantation (magnification ×100). Results are expressed in median with interquartile range (IQR). Statistical analysis was performed with Kruskal-Wallis Multiple comparison Dunn’s test. n = 6/group.

