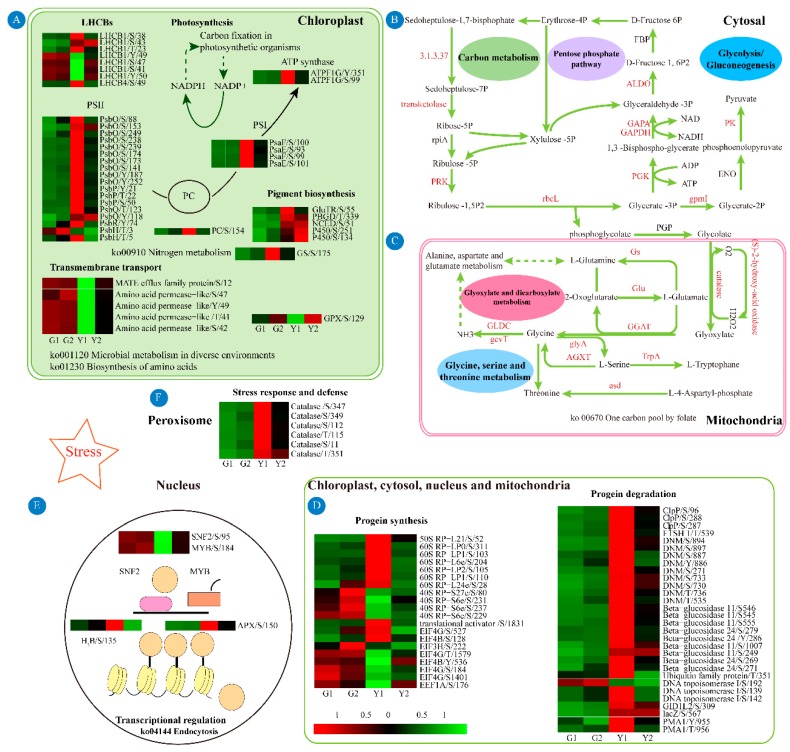
Figure 9.
Schematic presentations of proteins involved in central metabolisms at phosphorylation level in green and yellow sectors. Differentially phosphorylated proteins are integrated according to subcellular organelles. (A) DPs localized on chloroplasts, including pathways such as photosynthesis, light-harvesting antennas and pigment biosynthesis. (B) DPs localized on the cytosal, including pathways such as glycolysis/gluconeogenesis, pentose phosphate pathway and carbon metabolism. The phosphorylated enzymes (upper right) are shown in red. The arrows represent chemical reactions. (C) DPs located on mitochondria, including glyoxylate and dicarboxylate metabolism, glycine, serine, and threonine metabolism. (D) DPs involved in protein synthesis and degradation is present in chloroplasts, cytosal, nucleus and mitochondria. (E) DPs localized on nucleus, including transcriptional regulators, such as transcription factors and histones. (F) DPs located on peroxisome, mainly stress- and defense-related proteins were presented. The expression pattern of phosphorylation levels are shown by heat maps in the G1, G2, Y1 and Y2 sectors. The phosphorylated proteins are upregulated or downregulated in red and green, respectively.

